Analysis for the Reading Foundations standard began by determining the programs to be included. Both undergraduate and graduate (or post-baccalaureate) elementary teacher preparation programs that lead to initial licensure at all public institutions and private institutions that have an annual production of at least 10 elementary teachers were eligible for inclusion. This resulted in a universe of 1,147 programs housed within 960 institutions that qualified for analysis.23 Because not all programs provided sufficient documentation to be rated, the final sample includes 702 programs housed in 580 institutions of higher education, and is inclusive of programs in all 50 states and the District of Columbia.
Once the sample was determined, a team of analysts used course catalogs to identify the required coursework for each elementary program. Course titles and descriptions were used to identify all courses that addressed reading instruction. Next, NCTQ sent a request for course material to each program in the universe of programs. Programs were asked to identify any missing courses to ensure that no reading courses were excluded. The majority of syllabi analyzed were from fall 2018 to fall 2022, although some programs submitted materials from spring 2023 in response to the preliminary analysis. In total, collecting evidence, analyzing materials, and conducting the preliminary review process with all programs took 12 months to complete.
When material was received, course-level analysis relied on two sources of data:
Syllabi for required courses that address reading instruction, including ancillary materials such as lecture slides or assignment descriptions.
Background materials, such as textbooks or articles, for required courses that address reading instruction.
Following extensive training across several months, a separate team of expert reading analysts evaluated reading syllabi and background materials using a detailed scoring protocol. All 10 of these analysts are currently or were elementary teachers, six are certified in scientifically based reading techniques, and nine have completed at least a master's degree in the field of education.
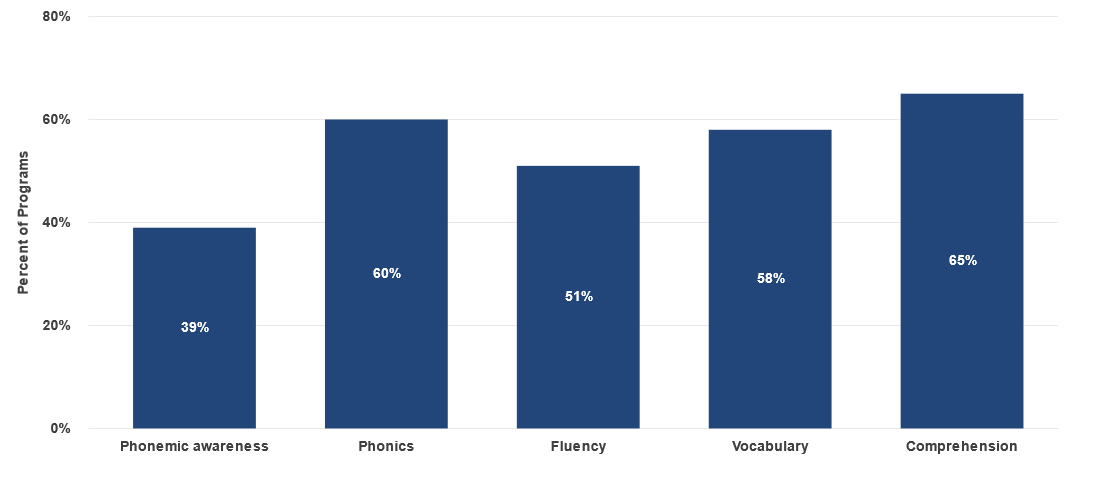
Expert analysts reviewed each course for its coverage of each of the five components of scientifically based reading instruction, and three components focused on supporting a range of learners.
Core components
Phonemic awareness |
The ability to focus on and manipulate the individual phonemes in spoken words. |
Phonics |
The relationship between the sound of spoken words and the individual letters or groups of letters representing those sounds in written words. |
Fluency |
The ability to read a text accurately and quickly while using phrasing and emphasis to make what is read sound like spoken language. |
Vocabulary |
Knowledge about the meanings, uses, and pronunciation of words. |
Comprehension |
Constructing meaning that is reasonable and accurate by connecting what has been read to what the reader already knows and thinking about all of this information. |
Supporting a range of learners
Struggling readers |
This group includes students who are falling behind and having academic difficulties in the area of reading; students at-risk of reading failure if they do not receive appropriate and effective instruction and intervention; and students with diagnosed or undiagnosed dyslexia, word reading difficulties, or language comprehension difficulties. |
English language learners |
This group includes students who are in the process of acquiring English and who have a first language other than English. |
Students who speak language varieties other than mainstream English |
This group includes students who speak variations of English including African American English (AAE), Cajun English, and Appalachian English, among others. Often these variations are referred to as dialects. |
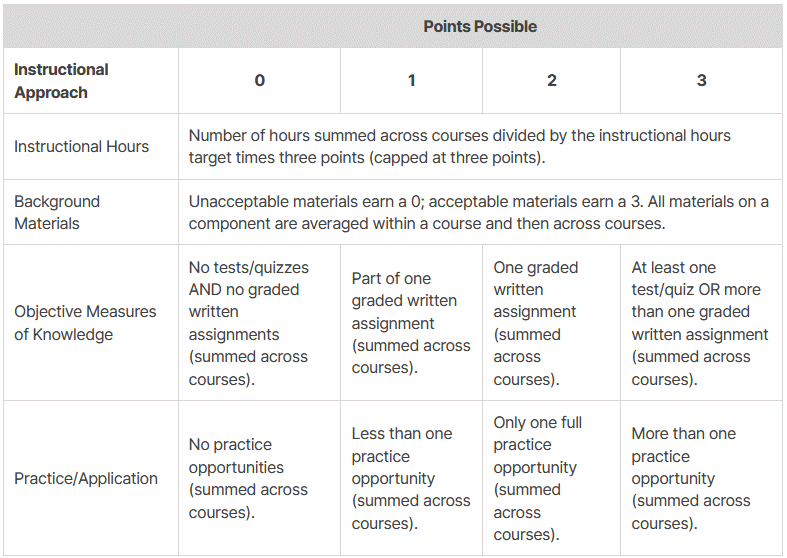
Course analysis for each component and for each student group relied on evidence that the program teaches the components based on four instructional approaches:
Use of instructional hours to address each component, as specified by the lecture schedule, as well as course time spent on content contrary to research-based practices.
Requirements for candidates to demonstrate knowledge of individual components through objective measures of knowledge (assignments or written, graded assessments).
Requirements for practice/application of instruction or assessment on individual components.
Requirements for background materials (e.g., textbooks, videos, articles), explored further below.
After expert analysts reviewed course syllabi for the first three instructional approaches—instructional hours, objective measures of knowledge, and practice opportunities—13% of programs were then randomly selected for evaluation by a second analyst to assess the frequency of scoring variances.
Another team of expert analysts separately analyzed the fourth instructional approach, required background materials. These materials were identified using the required reading section of course syllabi (or university bookstore information, in instances where course material is absent from syllabi). Reviewers analyzed each material for its coverage of the science of reading and attention to supporting a range of learners. The process of reviewing a book followed these steps:
The reviewer determines if the text is "comprehensive" (covers all five of the components), "specialized" (designed to cover only a subset of components), or "synopsis" (brief or introductory documents describing the components without sufficient depth to be used alone).
The reviewer determines if the content presents each component in light of the science, absent of unproven practice, and advances a depth of knowledge about not only how students learn to read, but also specifically how to teach students to read.
References were also checked for primary sources, researchers, and trusted peer-reviewed journals that present the consensus around the science of reading.
Each of the five core components (phonemic awareness, phonics, fluency, vocabulary, comprehension) was assessed separately for all four instructional approaches within each course, earning up to three points per approach, or 12 points per component.
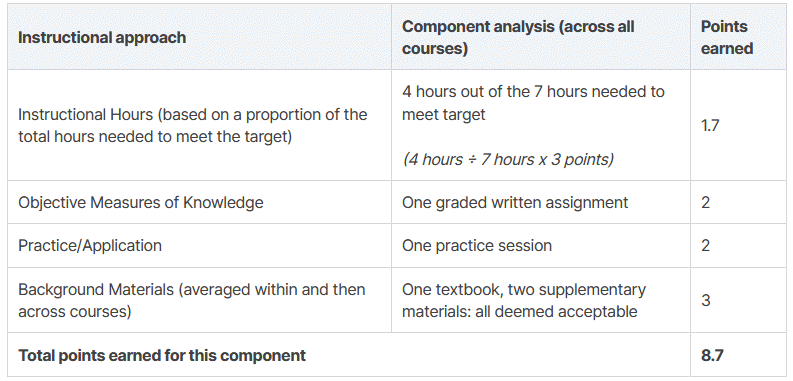
Example of scoring: Phonemic awareness
Example of scoring: Phonemic awareness
Instructional approach |
Component analysis (across all courses) |
Points earned |
Instructional Hours (based on a proportion of the total hours needed to meet the target) |
4 hours out of the 7 hours needed to meet target
(4 hours ÷ 7 hours x 3 points) |
1.7 |
Objective Measures of Knowledge |
One graded written assignment |
2 |
Practice/Application |
One practice session |
2 |
Background Materials (averaged within and then across courses) |
One textbook, two supplementary materials: all deemed acceptable |
3 |
Total points earned for this component |
8.7 |
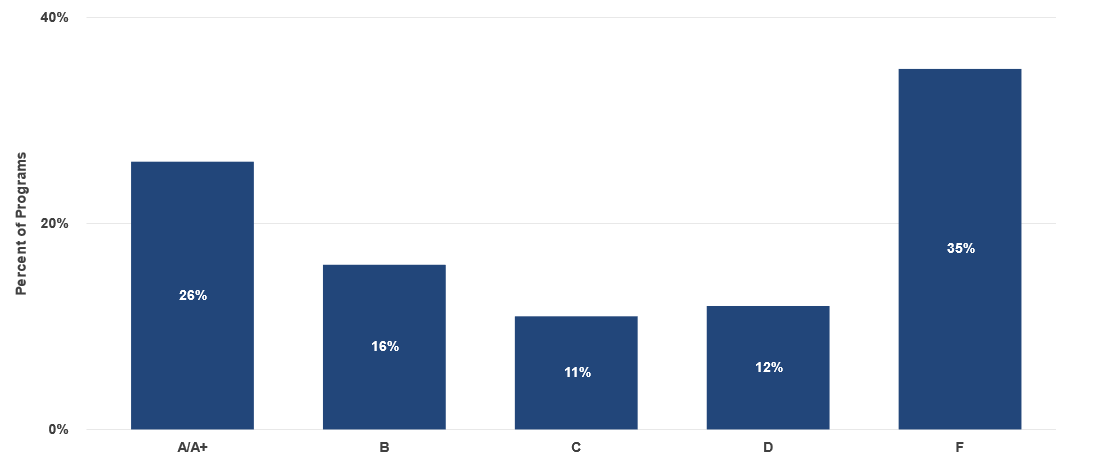
The sum of the course-level scores was used to produce a program-level score for each component (with a maximum of 12 points per component). To earn credit for a component, the program must have earned eight of 12 available points (or 67%). The five program-level component scores were used to determine the overall grade.
Content contrary to research-based practices
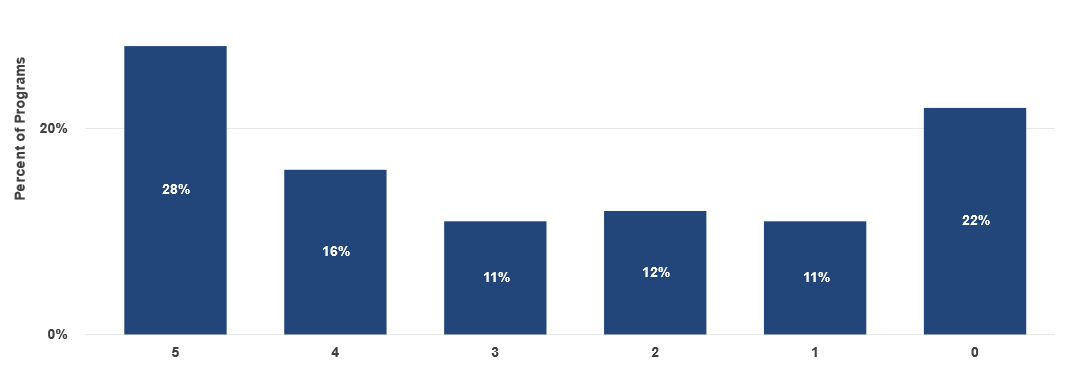
During the analysis of course materials, NCTQ expert analysts also determined whether there was evidence that a program teaches one of nine identified practices contrary to the science of reading. If a program teaches four or more contrary practices, its letter grade was reduced by one grade.
Three-cueing systems
Running records
Miscue analysis
Balanced literacy models
Guided reading
Reading Workshop
Leveled texts
Embedded/implicit phonics
Developmental Reading Assessment (DRA), Informal Reading Inventory (IRI), or Qualitative Reading Inventory (QRI)
Before NCTQ published program scores, programs received their scores with detailed feedback on the findings from each course and had at least two weeks to respond to provide any additional evidence, clarifications, or corrections.
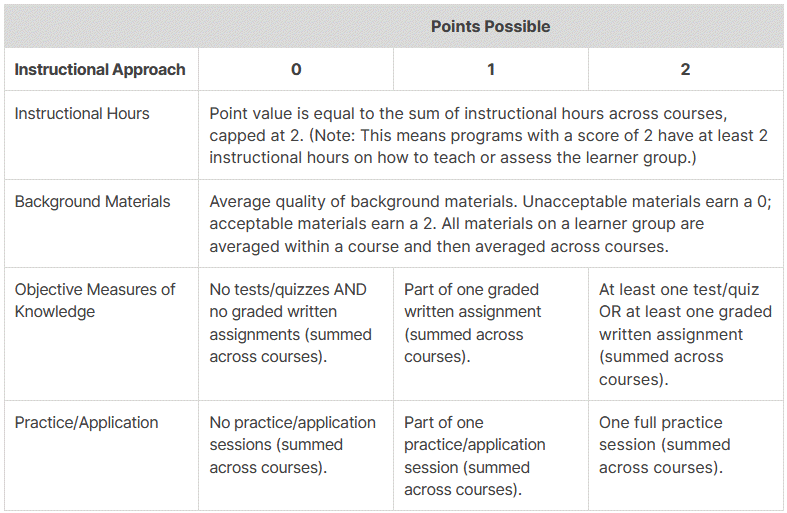
Supporting a range of learners
To evaluate whether prep programs provide instruction on how to support a range of learners (struggling readers, English learners, and students who speak English language varieties), analysts looked for at least two instructional hours dedicated to each learner group, as well as evidence the program uses research-based background materials, uses objective measures of knowledge to assess candidates' knowledge of how to use specific approaches to help these student groups learn how to read, and provides practice/application opportunities related to each group of students. Programs can earn up to two points for each instructional approach for each group of students (for a total of eight points for each student group). These areas are not included in a program's grade, but programs received detailed feedback on the evidence of their attention to supporting a range of learners.
For more information on the methodology for the Reading Foundations standard, see the full Reading Foundations: Technical Report.