
ABOUT THE PROJECT
Now more than ever, students need a strong, diverse teacher workforce ready for the classroom
The impact of the pandemic on student learning has been devastating, widening pre-existing achievement gaps. Compounding the issue, students of color and those living in poverty who are most in need of well-prepared teachers to help recover from learning opportunity losses are more likely to be taught by novice teachers still getting their bearings.
Closing these gaps necessitates that every new teacher enters the classroom ready on Day One, not just to get by but to excel.
While many skills and knowledge sets are necessary for elementary teachers, and there are many ways of measuring them, two critical components are: (1) knowing how to teach reading and (2) knowing the core content they will teach their students. Fortunately, these knowledge bases can be measured accurately and comprehensively with content and reading instruction licensure tests, required by nearly every state as a condition of earning a teaching license.
Over the past several years, NCTQ has worked with state education agencies and their testing companies to gather far more comprehensive licensure test data than has been available to date. This data helps illuminate a pivotal step in a teacher's pathway into the classroom by exploring:
- The quality of early reading and elementary content licensure tests required by states, identifying instances where states do not evaluate incoming teachers in these areas;
- How many aspiring teachers pass on their first attempt and how many ultimately pass these tests at the state and institution level;
- How many times aspiring teachers retake the tests and what proportion walk away after initially failing;
- Pass rates separated by race and ethnicity, institution-level admissions selectivity, and socioeconomic indicators.
This data can point toward institutions where most aspiring teachers leave well prepared in their knowledge of content and how to teach reading, including institutions that defy the narrative that success is relegated to wealthier, more selective institutions. This data also helps identify the many institutions where work remains to be done, and where aspiring teachers, and especially aspiring teachers of color, can be better supported in learning core content and skills. These efforts can help more aspiring teachers successfully reach the classroom, ready to be effective from day one.
FAQs
What are the goals of the project?
The nation needs a strong, diverse teacher workforce to fulfill its promise of equal opportunity for all. The quality of the teacher workforce is of paramount importance in the early grades, a time when teachers build the foundational skills that will not only determine students' success in later grades but also in their future lives.
Building a strong, diverse teacher workforce requires understanding the pathway into the classroom and the points along the pathway at which we lose candidates. Currently, policymakers, state education agencies, and teacher prep programs have little insight into the obstacles along this pathway, largely due to missing or inaccurate data. This makes it hard to identify when and why aspiring teachers, particularly candidates of color, exit the pathway and where to focus efforts and resources to support them before they leave the teaching profession.
Here NCTQ focuses on a pivotal point in the pathway for elementary teachers: when aspiring teachers take content and reading licensure tests as a condition for earning a teaching license. With this project, NCTQ seeks to:
- Gather, analyze, and make public accurate pass rate data that reflects pass rates for all test takers
- Illustrate how state and prep program leaders can interpret and act on data based on their policy priorities
- Shed light on how many aspiring teachers struggle to pass their licensure tests, highlighting opportunities to better support these students
- Identify "standout institutions" that defy the narrative that only wealthier, less diverse, or more selective institutions can earn high pass rates
- Note areas for improvements to the state's data system. This will increase the future use of data from licensure tests and other sources to understand and strengthen teachers' pathway into the classroom.
Having accurate, publicly accessible data is a foundational first step to building a diverse, effective teacher workforce. We cannot fix a problem we cannot see. Better data can shed more light on current circumstances and can help guide efforts to where they are most needed.
What are the benefits of a diverse teacher workforce?
Ample evidence demonstrates that all students benefit from having a diverse teacher workforce,1 and these benefits are especially critical for students of color. Students of color attain greater achievement when taught by same-race teachers,2 and for Black students, having even one Black teacher in elementary school is associated with an increased likelihood of high school graduation and college matriculation.3
Black and Hispanic teachers have higher expectations than white teachers that their same-race students will graduate4 and are less likely to see these students as having behavior problems5 or lower scholastic aptitude.6 Black teachers are more likely to assign high-performing Black students to gifted programs.7
While having teachers of color is tremendously important for the academic success of students of color, having a diverse workforce offers benefits for all students. Furthermore, students of all races have a lower likelihood of exclusionary discipline, such as suspension or expulsion, when taught by a Black teacher.8 Increased contact with diverse environments in childhood can also result in reducing implicit biases against other races during adulthood.9
REFERENCES
Blazar, D. (2021). Teachers of color, culturally responsive teaching, and student outcomes: Experimental evidence from the random assignment of teachers to classes. (EdWorkingPaper: 21-501.) Annenberg Institute at Brown University,
https://doi.org/10.26300/jym0-wz02 Egalite, A., Kisida, B., & Winters, M. (2015). Representation in the classroom: The effect of own race teachers on student achievement. Economics of Education Review, 45, 44-52; Goldhaber, D., & Hansen, M. (2010). Race, gender and teacher testing: How informative a tool is teacher licensure testing and how does it impact student achievement? American Educational Research Journal, 47(1), 218-251; Dee, T. S. (2004). Teachers, race, and student achievement in a randomized experiment. The Review of Economics and Statistics, 86(1), 195-210.
Gershenson, S., Hart, C. M. D., Hyman, J., Lindsay, C., & Papageorge, N. W. (2018). The long-run impacts of same-race teachers (NBER Working Paper No. 25254). Retrieved from
https://www.nber.org/papers/w25254 Fox, L. (2016). Seeing potential: The effects of student-teacher demographic congruence on teacher expectations and recommendations. AERA Open, 2(1), 1-17; Gershenson, S., Holt, S., & Papageorge, N. W. (2016). Who believes in me? The effect of student-teacher demographic match on teacher expectations. Economics of Education Review, 52, 209-224.
Bates, L., & Glick, J. (2013). Does it matter if teachers and schools match the student? Racial and ethnic disparities in problem behaviors. Social Science Research, 42, 1180-1190; Dee, T. S. (2005). A teacher like me: Does race, ethnicity, or gender matter? American Economic Review, 95(2), 158-165; Downey, D. B., & Prebish, S. (2004). When race matters: Teachers' evaluations of students' classroom behaviors. Sociology of Education, 77, 267-282; Lindsay, C. A., & Hart, C. M. D. (2017). Teacher-student race match and student disciplinary outcomes in North Carolina. Educational Evaluation and Policy Analysis, 39(3), 485-510; Wright, A., Gottfried, M., & Le, V. N. (2017). A kindergarten teacher like me: The role of student-teacher race in socio-emotional development. American Educational Research Journal, 54(1 Suppl.), 78S-101S.
Dee, T. S. (2005), McGrady, P. B., & Reynolds, J. R. (2012). Racial mismatch in the classroom: Beyond black-white differences. Sociology of Education, 86(1), 3-17.
Grissom, J. A., & Redding, C. (2016). Discretion and disproportionality: Explaining the underrepresentation of high-achieving students of color in gifted programs. AERA Open, 2(1), 1-25. Retrieved from
https://journals.sagepub.com/doi/pdf/10.1177/2332858415622175 Lindsay & Hart, 2017.
Kubota, J. T., Peiso, J., Marcum, K., & Cloutier, J. (2017). Intergroup contact throughout the lifespan modulates implicit racial biases across perceivers' racial group. PLOS ONE, 12 (7), e0180440.
What is the profile of the current teacher workforce?
Currently, the teacher workforce is far less diverse than the public student body. Across the United States, just over 80% of teachers identify as white,1 compared with only 45% of students.2 The teacher workforce is also less diverse than the current adult population in this country (73% identify as white). This difference in racial representation among teachers and students is only likely to grow if we aren't intentional about diversifying the teacher pathway at every step.
Aspiring teachers of color are lost at virtually all points along the teacher pipeline. Fewer students of color earn college degrees or are interested in teaching.3 Candidates of color pass licensure tests at lower rates than their white peers.4 Of those who earn teaching licenses, Black and Hispanic teachers are hired for teaching positions at lower rates than white teachers,5 although recent data suggests that this trend may be turning around.6 Teachers of color are retained in teaching jobs at lower rates than white teachers, often because they work in more challenging school settings.7
Clearly, many points in the pipeline need to be addressed if we hope to achieve a diverse teacher workforce at scale, including success on licensure tests. Supporting aspiring teachers of color to pass licensure tests is a key area deserving of attention.
REFERENCES
U.S. Department of Education. Institute of Education Sciences, National Center for Education Statistics. (2022). Table 209.22. Number and percentage distribution of teachers in public elementary and secondary schools, by instructional level and selected teacher and school characteristics: 1999-2000 and 2017-2018. In U.S. Department of Education, National Center for Education Statistics (Ed.), Digest of Education Statistics. Retrieved from
https://nces.ed.gov/programs/digest/d22/tables/dt22_209.22.asp U.S. Department of Education. Institute of Education Sciences, National Center for Education Statistics. (2020). Table 203.70. Percentage distribution of enrollment in public elementary and secondary schools, by race/ethnicity and state or jurisdiction: Fall 2000 and Fall 2018. In U.S. Department of Education, National Center for Education Statistics (Ed.), Digest of Education Statistics. Retrieved from
https://nces.ed.gov/programs/digest/d20/tables/dt20_203.70.asp?current=yes Putman, H., Hansen, M., Walsh, K., & Quintero, D. (2016). High hopes and harsh realities: The real challenges to building a diverse workforce. Brookings Institution. Retrieved from https://www.nctq.org/publications/High-Hopes-and-Harsh-Realities:-The-real-challenges-to-building-a-diverse-workforce
Putman, H., & Walsh, K. (2019). A fair chance: Simple steps to strengthen and diversify the teacher workforce. National Council on Teacher Quality.
Putman, et al., 2016.
Putman, H. (2021). The turning tide: Greater interest in teaching among Black and Hispanic students. Teacher Quality Bulletin. Washington, DC: National Council on Teacher Quality. Retrieved from https://www.nctq.org/blog/The-turning-tide:-Greater-interest-in-teaching-among-Black-and-Hispanic-students
Putman, H., Hansen, M., Walsh, K., & Quintero, D., 2016.
How many states currently require elementary content licensure tests?
Twenty-eight states require elementary teacher candidates to pass a test of their content knowledge.1 Twenty of the remaining offer candidates an alternative to passing a licensure test, including having a degree or major in the content area or completing a content-based portfolio, and one (Iowa) dropped a requirement to demonstrate content knowledge altogether. North Carolina only requires passage of an elementary subtest in mathematics, and teachers have three years to pass this subtest. New Mexico will soon switch to a portfolio-based system, using licensure tests only for out of state applicants and "unique circumstances."2
Some states also require basic skills tests (e.g., the Praxis CORE) and/or performance assessments (e.g., the edTPA). This analysis focuses only on content tests required for elementary teachers, and so does not consider basic skills or performance assessments.
REFERENCES
National Council on Teacher Quality. (2020). Content knowledge national results. State Teacher Policy Database. [Data set]. Retrieved from: https://www.nctq.org/yearbook/national/Content-Knowledge-90. Not reflected in the State Teacher Policy Database, Montana now offers candidates the choice of taking the licensure test or submitting a portfolio to demonstrate their content knowledge, and New Mexico will soon end its licensure test requirement and replacing it with a portfolio requirement in 2024, and West Virginia now waives licensure tests for candidates with a Master's degree and five years of work experience in their area. In addition to these states, Delaware and Missouri allow a subset of candidates to substitute other evidence in lieu of passing a content licensure test, and Utah allows some exemptions although teachers must still pass the content test within three years to earn a professional license. Swisher, A. (2022, July 28). Setting sights lower: States back away from elementary teacher licensure tests. Teacher Quality Bulletin. National Council on Teacher Quality. https://www.nctq.org/blog/Setting-sights-lower:-States-back-away-from-elementary-teacher-licensure-tests.
National Council on Teacher Quality. (2020). Content knowledge national results. State Teacher Policy Database. [Data set]. Retrieved from: https://www.nctq.org/yearbook/national/Content-Knowledge-90; Swisher, A. (2022, July 28). Setting sights lower: States back away from elementary teacher licensure tests. Teacher Quality Bulletin. National Council on Teacher Quality. https://www.nctq.org/blog/Setting-sights-lower:-States-back-away-from-elementary-teacher-licensure-tests. Additional states have made changes since these two publications were released; for additional information, contact NCTQ.Warniment, G. (2022). Memorandum re. updated requirements for teacher licensure. State of New Mexico Public Education Department. Retrieved September 27, 2023 from https://webnew.ped.state.nm.us/wp-content/uploads/2022/05/Updates_to_Praxis_Requirements_2022_1_.pdf
When do candidates take content licensure tests?
In nearly every state, candidates must pass a content licensure test before they can earn a teaching license. For elementary candidates, this test typically addresses mathematics, English language arts, science, and social studies, although these tests will sometimes include other topics like art, health, or physical education. (For more on states' requirements on licensure tests, see the State Teacher Policy Database, and for more on the topics see page 6 of Examining states' testing systems.) Beyond that basic requirement of passing the test in order to earn a license, there is a great deal of leeway as to when candidates must take or pass a licensure test, and the timing is often decided by the preparation program.
Most often, programs report requiring candidates to take (though not necessarily pass) the content licensure test before they are allowed to do their clinical placement (or "student teaching"). Many programs require passing the content test as a condition of completing the teacher preparation program.
In some rare cases in traditional-route programs at the graduate and undergraduate levels, candidates may have to take a content test at the point of admission into the program. NCTQ reviewed admissions materials for 894 undergraduate elementary education programs and 324 elementary graduate programs, finding only 3% that require candidates to take a content test as part of the admission process (and not all require candidates to pass it).
Alternative route programs have similar variation as to when they require licensure tests, although state policy plays a larger role in when these programs require content licensure tests. As of 2020, in 13 states, all alternative route candidates must pass a content licensure test prior to admission into a program (see figure below).
State policy requires all alternate route candidates to pass a subject-matter test prior to admission into the program.
Timing of the licensure test is important. If candidates take it too late in the program, they have little time to close any gaps in their content knowledge, making it harder for them to earn a teaching license. This is especially true for undergraduate candidates, who take many relevant content courses as part of their general education course requirements. However, programs may not want candidates to bear the costs of licensure tests too early; in this case, a diagnostic exam would be a useful tool to identify candidates' content strengths and shortfalls to address needed supports.
When do candidates take reading licensure tests?
In most states,1 candidates must pass a licensure test before they can earn a teaching license. (For more on states' requirements on licensure tests, see the State Teacher Policy Database.) Most often, programs report requiring candidates to take (though not necessarily pass) reading licensure tests before they are allowed to do their clinical placement (or student teaching). Many programs require passing the reading licensure tests as a condition of completing the teacher preparation program.
While NCTQ did not track when programs require tests in early reading, it is unlikely that these would come before admission into the program, as learning how to teach reading is generally an essential part of elementary teacher preparation. Indeed, it would be surprising if candidates were required to take and pass early reading licensure tests before candidates complete the coursework in teaching early reading.
For alternative route programs, 20 states require that all elementary alternate route candidates take a test, while seven require only some alternate route elementary candidates to take a reading licensure test.2 Only two states (Mississippi and Texas) require that all alternate route candidates pass a test that fully measures the science of reading before becoming a teacher of record.
REFERENCES
Forty-three states require all candidates to take a reading licensure test prior to earning a teaching license, while eight states allow some candidates to bypass or postpone the test. National Council on Teacher Quality. (2021). Teaching reading national results. State Teacher Policy Database. [Data set]. Retrieved from https://www.nctq.org/yearbook/national/Teaching-Reading-90
National Council on Teacher Quality. (2020). Program entry national results. State Teacher Policy Database. [Data set]. Retrieved from https://www.nctq.org/yearbook/national/Program-Entry-93
Do test takers need to be enrolled in a program to take a test?
States vary in their rules around who can take a licensure test. Most states allow anyone (in the state or elsewhere) to take teacher licensure tests. In a few states, such as Georgia, test takers must meet certain criteria, such as having approval from their preparation program to take the test or being a certified teacher who is seeking an additional certification.
The challenge when states allow anyone to take the tests, regardless of whether (or not) they have enrolled in teacher prep programs, is that their pass rate data may include both test takers who are enrolled in teacher preparation programs and those who are not, making it more difficult to draw conclusions from the data.
To learn more about states' policies on who can take licensure tests, NCTQ sent a survey to leaders from all 50 state and D.C. education agencies asking about their requirements for who can take an elementary content licensure test. We received responses from 43 SEAs.
Of these, 38 states (88%) allow anyone to take a test regardless of whether they're enrolled in a preparation program. The remaining five states (12%) set some requirements. Common requirements include being enrolled in a teacher preparation program, being approved by a program to take the test, being a licensed teacher seeking an additional certification or seeking to move from another state to the state in question, and applying for an alternative certification program.
Of the 38 states that responded to the survey and that allow anyone to take the test, half (19 states) can distinguish pass rate data between who is enrolled in a prep program and who is not. Eight states (19%) cannot distinguish between the two groups, two states said that they could get this data from their testing provider, and the remainder were not sure or said that it depended on the information the test taker supplied when registering for the test. This is important because it means that when states review the results of the licensure test data, they have limited insight into the quality of the preparation program, which is one of the key ways that this data can be used to strengthen the quality of the teacher workforce.
Further discussions with states revealed that in most cases state education agencies should be able work with their testing company to get data limited to test takers who are enrolled in teacher prep programs. For Title II data, the testing companies typically work with preparation programs to validate pass rate data by having programs "claim" test takers as being enrolled in or having completed their program. States could use this list of claimed test takers to remove those who are not enrolled in teacher preparation programs, or they can request that their testing companies do so.
For the data provided by states on elementary content licensure tests, nearly every state provided data on all test takers, rather than only on teacher candidates. For the early reading licensure pass rates data request, NCTQ has explored pathways for testing companies to develop a procedure to limit the data only to teacher candidates. States can decide whether to request data on all test takers or only on teacher candidates when submitting the pass rates data request to their testing company. If the testing company also provides analyses of pass rates for Title II federal reporting requirements, the testing company should be able to comply with either option. The early reading dashboards indicate which set of test takers are included in the analysis.
How are cut scores set?
A "cut score" is the minimum score on the test used by the state to determine whether a test taker has passed the test and can be awarded a license. Standardized tests, including licensure tests, generally go through a standard setting process, which uses aggregated judgments from experts, typically including teachers, to determine a recommended passing score. In light of that expert recommendation, states can then choose where to set their own passing score. As described by ETS, one of the two large testing companies:
"Standard-setting studies serve two purposes. First, they are designed to identify the level of knowledge for a test taker to be considered minimally qualified for independent, beginning practice. The level of knowledge is represented by a minimum test score that test takers need to achieve. Second, the studies are designed to reconfirm the relevance (validity) of the test content for teachers in the adopting state."1
On tests developed by ETS, nearly all states follow the recommended passing score.2 On tests developed by Pearson, technical reports and test websites publish the passing score in use by the state, but there is often less transparency around what the recommended passing score is because Pearson does not release any information (including recommended cut scores) to the public unless requested by the state education agency,3 and therefore it is less clear whether states are setting an appropriate passing score or not.
REFERENCES
ETS. (2021). Standard-setting studies. ETS Praxis. Retrieved from https://www.ets.org/praxis/site/states-agencies/test-adoption/standard-setting-studies.html
Recommended minimum passing scores are available here: https://www.ets.org/praxis/states_agencies/adoption_process/standard_setting_studies/multistate. States' minimum passing scores on ETS tests are available here: https://www.ets.org/praxis/institutions/scores/passing
L. Wilson, personal communication, April 22, 2021.
Aren't pass rates already published via Title II?
Programs report two sets of pass rates data through Title II. For "single assessment pass rates," programs report best-attempt pass rates for all candidates enrolled in or completing their program. The best-attempt pass rate represents pass rates after test takers have had multiple opportunities to retake the test, and counts their highest score from any of those attempts. Most elementary content licensure tests have multiple subtests, in which case these pass rates are reported on the subtest level rather than on the composite test.
The other set of data is the "summary pass rate," which is the proportion of test takers who passed all of their licensure tests. These summary pass rates have limited utility. They are reported in aggregate at the institution level and are only reported for "program completers." Because programs can require passing the licensure test as a condition of completing the program, the Title II federal reporting requirements allow programs to exclude candidates who took the test but were unable to pass, resulting in average program completer pass rates of 95-96%.2 This paints a far rosier picture than the reality for aspiring elementary teachers.
The Department of Education's report explains the shortcoming in Title II data:
"Some institutions require individuals enrolled in teacher education programs to pass the state licensure assessment in order to complete the program; other institutions do not. Consequently, institutions that require students to pass state assessments for program completion will report 100 percent pass rates, but many institutions without such a requirement will not have 100 percent pass rates. Thus, in comparing pass rates across institutions, one does not gain a clear understanding of which ones may better prepare candidates."3
Neither the single assessment pass rates nor the summary pass rates shed light on the extent to which elementary teacher candidates require multiple attempts to pass. This data also does not include first-attempt pass rates, nor does it include pass rates disaggregated by race/ethnicity. Finally, reporting single assessment pass rates at the subtest level, but not the composite, obscures whether the same candidates are struggling across all subtests.
Additional detailed and inclusive data would be more actionable for teacher prep programs and state education agencies.
REFERENCES
Programs, often in line with state requirements, can determine that passing the licensure test is one of the requirements to complete the program. Consequently, anyone who does not pass a licensure test is not a program completer and therefore is excluded from the summary pass rate data.
Programs report summary pass rate data for "program completers" but can determine what candidates must do to complete the program. Many programs require passing licensure tests as a condition of completing the program and therefore report 100% pass rates because they do not report pass rates for those who failed the test and by definition did not complete the program. This is a well-documented problem. See, for example, p. 92 of U.S. Department of Education, Office of Postsecondary Education. (2016). Preparing and credentialing the nation's teachers: The Secretary's 10th report on teacher quality. Washington, DC. Retrieved from https://title2.ed.gov/Public/TitleIIReport16.pdf
U.S. Department of Education, Office of Postsecondary Education. (2016). Preparing and credentialing the nation's teachers: The Secretary's 10th report on teacher quality, p. 92. Washington, DC. Retrieved from https://title2.ed.gov/Public/TitleIIReport16.pdf
Why are first-attempt pass rates meaningful?
Most data reported on licensure tests only considers "best-attempt" pass rates, or the pass rates after test takers have had multiple opportunities to retake the test. While best-attempt pass rates are informative, the education field should also consider what candidates' first-attempt pass rates can reveal about preparation, persistence, and completion rates for aspiring teachers.
First, when aspiring teachers fail the licensure test, they can regroup, study more, seek out additional support, and take the test again. But faced with this decision point, some aspiring teachers do not make another attempt. Identifying what proportion of candidates struggle to pass the test on their first attempt, paired with information about what proportion of candidates who fail do not retake the test, can spotlight a significant loss of aspiring teachers.
Second, first-attempt pass rates may offer one indication of how well candidates' institutions and preparation programs have prepared them in core content knowledge before expecting them to take their licensure tests. Elementary candidates learn core content knowledge from their K-12 education, as well as from general education requirements and any additional courses their preparation program requires. First-attempt pass rates may, in aggregate, offer insight into whether candidates' institutions and preparation programs proactively ensure that the candidates learn core content prior to taking the test. Low pass rates may suggest that programs and their institutions need to collaborate to offer more and earlier support for their candidates.
Are licensure tests biased?
A frequent concern about licensure tests is that they disproportionately keep candidates of color from earning licenses and the disproportionate impact may result from bias in the tests. While it may not be possible to fully remove bias from any exam, test designers take steps to measure whether bias is present and to remove any questions that may lead to differences in outcomes based on anything other than one's understanding of the subject(s) being tested.
These steps may include:
- Establishing guidelines for writing assessment questions that identify terms, topics, and formats to avoid
- Inviting experts focused on equity and content to review test materials
- Calculating statistical differences among groups on assessment items
- Investigating score differences among racial groups, men and women, test takers with disabilities, and English language learners (when sample size allows)
- Identifying test items that lead to large score differences among groups, and removing the items unless they can be justified to meet the content specifications for the assessment and the item has passed through an independent review.
Despite these approaches to mitigate bias, many remain concerned that bias still permeates licensing exams, given the lower pass rates for Black and Hispanic test takers compared with white test takers, at least on the most commonly required elementary content licensure test.1 However, it becomes difficult to disentangle whether these pass rates differ due to problems with the test itself or to systemic inequities in the quality of education available to different groups.2
Qualitative analysis has explored the "affective dimension" of the experience of taking a licensure test, finding that for test takers of color, the experience of taking the test (e.g., negative and potentially racist interactions with a test proctor) can undermine the test takers' confidence and set off stereotype threats or "identity threats."3 However, several studies note that preparation and support from the test taker's preparation program can mitigate some of the nervousness that accompanies taking a licensure test and can generally support candidates in achieving greater success.4 When reviewing tests for bias, test publishers should consider not only the content of the test but also the affective experience. This review could highlight the need for other changes, such as additional training for test proctors, to make the testing experience more welcoming and calming for test takers.
Concerns about the tests themselves remain.5 One study argues that small amounts of bias at the test item level may accrue into larger test-level biases; this "accretionary bias" could occur even if individual test items are not identifiably problematic.6 Several studies assert that the test is biased against test takers whose first language is not English.7
Some have also raised concerns about omissions in the content of licensure tests. Elementary curricula, and the teacher licensure tests that intersect with them, may lack diverse perspectives and content. As curriculum designers work to diversify their materials, so too may testing designers need to expand the scope of their exams. If exams are missing some core content that is relevant but untested, candidates who have more knowledge of those areas may be at a disadvantage when taking the test.
Unfortunately, concerns around bias are not unique to licensure tests. Other measures of teacher quality and performance have raised concerns as well. For example, research on teacher observation scores suggests that performance assessments that include a video of the candidate teaching a class of students may result in lower scores depending on the background of the students (e.g., socioeconomic status and incoming achievement).8 Any alternative to licensure tests should be scrutinized for evidence of bias in the same way that licensure tests have been.
The solution often offered to address concerns of bias is to drop licensure tests altogether. However, doing so to solve one problem may create a greater one. If states lose a guardrail to ensure that teachers enter the classroom knowing the content they will teach, they risk perpetuating opportunity gaps for the very students who most need teachers who can build their foundational knowledge, and threaten the knowledge base for all students, including those who may seek to become teachers in the future.
REFERENCES
On the most commonly required elementary content licensure test, ETS data shows that while 75% of white test takers pass after one or more attempts, that rate drops to 57% for Hispanic test takers and to only 38% for Black test takers. Putman, H., & Walsh, K. (2019). A fair chance: Simple steps to strengthen and diversify the teacher workforce. National Council on Teacher Quality. Retrieved from https://www.nctq.org/publications/A-Fair-Chance. Numerous other studies have pointed to disparities in pass rates for candidates of color: Goldhaber, D., & Hansen, M. (2010). Race, gender, and teacher testing: How informative a tool is teacher licensure testing? American Educational Research Journal, 47(1), 218-251; Stedman, J. B., & Mangan, B. F. (2004). Pass rates as an accountability measure for teacher education programs. Washington, DC: Congressional Research Service, Library of Congress; Redmond, C., Clinedinst, M., & O'Brien, C. (2000). Educating the emerging majority: The role of minority-serving colleges & universities in confronting America's teacher crisis. A Report from the Alliance for Equity in Higher Education (this study argues that using test scores as gatekeeper keeps aspiring teachers of color from pursuing a teaching career); Gitomer, D. H., & Latham, A. S. (2000). Generalizations in teacher education: Seductive and misleading. Journal of Teacher Education, 51(3), 215-220; Stedman & Mangan, 2004; Nettles, M. T., Scatton, L. H., Steinberg, J. H., & Tyler, L. L. (2011). Performance and passing rate differences of African American and white prospective teachers on PraxisTM examinations: A joint project of the National Education Association (NEA) and Educational Testing Service (ETS). ETS Research Report Series, 2011(1), i-82; Shuls, J. V. (2018). Raising the bar on teacher quality: Assessing the impact of increasing licensure exam cut-scores. Educational Policy, 32(7), 969-992. One study noted little difference in pass rates by race/ethnicity but found a larger disparity by test takers' sex: Pecheone, R. L., & Chung, R. R. (2006). Evidence in teacher education: The performance assessment for California teachers (PACT). Journal of Teacher Education, 57(1), 22-36.
A paper by ETS states, "…differences in test performance among groups are often regarded, in and of themselves, as an indication of test bias, ignoring performance on the external criterion that the test is designed to predict. Often, groups that perform poorly on tests also tend to perform poorly on measures of the criterion." In other words, differences in pass rates may be indicative of disparity in the test, or they may be measuring actual differences in candidates' knowledge. Beller, M. (2005). Test bias. Princeton, NJ: Educational Testing Services. A study that considered processes to identify and remove bias in licensure tests noted that this process is "subjective." Rose, E. (1994). With the phasing out of the NTE, do either the Content Mastery Examinations for Educators (CMEE) or the "Praxis Series" meet the requirements of a competency-based assessment for beginning teachers in Montana? A Report to the Board of Public Education, State of Montana.
Petchauer, E. (2014). Slaying ghosts in the room: Identity contingencies, teacher licensure testing events, and African American preservice teachers. Teachers College Record, 116(7), 1-40; Bennett, C. I., McWhorter, L. M., & Kuykendall, J. A. (2006). Will I ever teach? Latino and African American students' perspectives on PRAXIS I. American Educational Research Journal, 43(3), 531-575; Flippo, R. F., & Canniff, J. G. (2000). Teacher competency whitewash: How one high stakes test eliminates diversity from the teaching force. Connection: New England's Journal of Higher Education and Economic Development, 15 (2), 28-31.
Barth, P. (2004). The real value of teachers: If good teachers matter, why don't we act like it? Thinking K-16, 6(1), Winter 2004. Washington, DC: Education Trust; Petchauer, E., Baker-Doyle, K. J., Mawhinney, L., & Ciarkowski, B. (2015). "Since feeling is first": Exploring the affective dimension of teacher licensure exams. Multidisciplinary Journal of Educational Research, 5(2), 167-195; Bennett, McWhorter, and Kuykendall. (2006); Gitomer, D. H., Latham, A. S., & Ziomek, R. (1999). The academic quality of prospective teachers: The impact of admissions and licensure testing. (ETS Research Report No. RR-14-35.) Princeton, NJ: Educational Testing Service; Nettles, M. T., Scatton, L. H., Steinberg, J. H., & Tyler, L. L. (2011). Performance and passing rate differences of African American and White prospective teachers on Praxis examinations. (Research report ETS RR-11-08.) Retrieved from http://files.eric.ed.gov/fulltext/ED523733.pdf. One study argues that the diversity of the teacher prep program's faculty itself can also support candidates of color in passing licensure tests. Wenglinsky, H. (2000). Teaching the teachers: Different settings, different results. Policy Information Report. Princeton, NJ: Educational Testing Center.
Smith argues that licensure tests are screening test takers for race rather than teacher quality. Smith, G. P. (2000). The minority teacher shortage and testing. Multicultural Perspectives, 2(3), 34-38. Tellez, K. (2003). Three themes on standards in teacher education: Legislative expediency, the role of external review, and test bias in the assessment of pedagogical knowledge. Teacher Education Quarterly, 30(1), 9-18.
Bennett et al. share the experiences of focus group participants. Bennett, C. I., McWhorter, L. M., & Kuykendall, J. A. (2006). Will I ever teach? Latino and African American students' perspectives on PRAXIS I. American Educational Research Journal, 43(3), 531-575.
Flippo and Canniff assert that linguistic barriers may drive lower passing rates, though do not support this assertion. Flippo, R. F., & Canniff, J. G. (2000). Teacher competency whitewash: How one high stakes test eliminates diversity from the teaching force. Connection: New England's Journal of Higher Education and Economic Development, 15 (2), 28-31.
Gill, B., Shoji, M., Coen, T., & Place, K. (2016). The content, predictive power, and potential bias in five widely used teacher observation instruments. REL 2017-191. Regional Educational Laboratory Mid-Atlantic. Retrieved from https://files.eric.ed.gov/fulltext/ED569941.pdf; Steinberg, M. P., & Garrett, R. (2016). Classroom composition and measured teacher performance: What do teacher observation scores really measure? Educational Evaluation and Policy Analysis, 38(2), 293-317; Steinberg, M. P., & Sartain, L. (2020). What explains the race gap in teacher performance ratings? Evidence from Chicago Public Schools. Educational Evaluation and Policy Analysis, 43(1).
What are the benefits of licensure tests?
Licensure tests that meet the hallmarks of a strong assessment provide myriad benefits. First, they are essential to ensuring that new teachers enter the classroom with a firm grasp of what they will teach. Second, they offer aggregate data that can shed light on systemic inequities in education, offering an opportunity to break the cycle. Third, data from these tests can spotlight institutions that are better supporting all test takers in passing licensure tests, demonstrating that greater success is possible. And fourth, this data can indicate institutions where candidates struggle to build foundational knowledge in core skills and subjects, and consequently fail to pass the tests, and highlight how important it is for the institution to focus on better supporting candidates.
How can we create meaningful comparisons among different institutions?
To draw meaning from pass rate data, it can be helpful to look within each institution but also among institutions. Comparing pass rates on the same exam among all institutions can help identify strong performers and promising practices from which others can learn and can point to instances where institutions may not be providing their candidates with enough support. However, there is no single metric that fully encapsulates the data from licensure test pass rates; numerous ways to compare pass rates among institutions exist. Depending on what state education agency and preparation program leaders value, they can determine what and how to measure and compare pass rates.
Some possibilities include:
- To explore where most candidates are passing, regardless of the number of attempts, examine institutions' best-attempt pass rates
- To discover where candidates save time and money by passing on their first attempt, examine institutions' first-attempt pass rates
- To identify and scale practices from institutions that successfully support all groups of candidates, sort pass rate data by categories such as admissions selectivity or proportion of Pell Grant recipients
- To identify institutions supporting teachers of color in entering the workforce, examine pass rate data for test takers of color
- To explore where candidates are more likely to succeed with the least amount of time and money spent on test taking, examine retake rates
- To examine where aspiring teachers get lost in the pipeline, examine the walk-away rate—the proportion of test takers who fail on their first attempt and do not retake the test.
Why are pass rates important in understanding the overall supply of the teacher workforce?
Passing a content licensure test is, for many teachers, one of the final requirements in their pathway into the classroom. Pass rate data can help identify where programs are better supporting their candidates, where candidates are being lost before they earn a license, and where candidates of color are most likely to be successful. Having clear information about pass rates on licensure tests is one important piece of a broader system of data to identify obstacles and opportunities in building a stronger, more diverse teacher workforce.
How will pass rate data transparency support efforts to diversify the workforce?
Research unequivocally demonstrates the importance of having a diverse workforce, especially for Black students having the opportunity to learn from Black teachers. However, the current teacher workforce is far less diverse than the student body. Potential teachers of color are lost at many points along the pathway into the classroom,1 and therefore identifying the scope of this loss at each point, including passing licensure tests, can help states and preparation programs identify where to target efforts and resources to support more aspiring teachers of color in reaching the classroom.
NCTQ rejects the notion that the field must lower standards for new teachers in order to increase teacher diversity. Ample evidence shows that teacher preparation programs can be both selective and diverse,2 and data from licensure tests can point to programs that support candidates of color in passing their licensure tests at the same, or sometimes higher, rate as their white peers. If systemic inequities and gaps in education have created lower pass rates, especially for candidates of color, then it is incumbent upon our academic institutions to identify and rectify these inequities so that the teachers who reach our classrooms are ready to provide a content-rich, engaging curriculum. Better preparation is the way to halt this vicious cycle.
REFERENCES
Putman, H., Hansen, M., Walsh, K., & Quintero, D. (2016). High hopes and harsh realities: The real challenges to building a diverse workforce. Washington, DC: Brookings Institution. Retrieved from https://www.nctq.org/publications/High-Hopes-and-Harsh-Realities:-The-real-challenges-to-building-a-diverse-workforce
Drake, G., Ellis, C., Moorer, A., & Walsh, K. (2021). Teacher Prep Review: Program diversity and admissions. Washington, DC: National Council on Teacher Quality. Retrieved from https://www.nctq.org/publications/Teacher-Prep-Review:-Program-Diversity-and-Admissions-2021
What is the role of testing companies in building better data systems?
Testing companies can support the work of states and prep programs in building better data systems in numerous ways. For example:
- Give all state education agencies a report on first-attempt and best-attempt pass rates for all program test takers—and not only program completers—as a standard operating procedure. Include data disaggregated by the race/ethnicity of test takers.
- Build user-friendly data systems that allow SEA and EPP leaders and staff to conduct their own analyses.
- Use the process through which prep programs match test takers to their programs for Title II data reporting to similarly match test takers to programs for pass rate reports back to the states. This will address the problem of including both those enrolled in preparation programs and those who are not in pass rate data, and will support more meaningful action based on these pass rates.
ABOUT CONTENT KNOWLEDGE
Exploring pass rate data from different perspectives is key to building a stronger, more diverse teacher workforce.
The nation needs a strong, diverse teacher workforce to fulfill its promise of equal opportunity for all. The quality of the teacher workforce is of paramount importance in the early grades, a time when teachers bear an extraordinary responsibility — laying the foundational skills that not only will determine students' success in later grades but also in their future lives.
Unfortunately, too many aspiring teachers — especially aspiring teachers of color — aren't making it into the classroom. Exacerbating the issue, policymakers, state education agencies, and teacher prep programs have little insight into the points at which we lose aspiring teachers.
NCTQ has released a previously unavailable pivotal set of data that can help illuminate one possible point at which we lose too many teacher candidates: teacher licensure tests. These tests typically assess the math, science, social studies, and English language arts knowledge that elementary teachers will be expected to know and teach.
Elementary teacher candidates, regardless of race and ethnicity, are too often poorly prepared for their state licensing tests. In fact, more than 50% fail on their first attempt in states that use a well-structured content licensure test, and many never persist in their pathway into the classroom. This is especially true for aspiring teachers of color.
Having accurate, publicly accessible data is a foundational first step to improving pass rates and delivering better prepared, more diverse teachers to the classroom.
This volume of elementary content pass rate data demonstrates how it can be viewed through different lenses to gain insight into the quality of preparation — including the level of encouragement for retaking a failed test, persistence on the part of aspiring teachers, and commitment and innovation to overcome educational inequities and inadequate K-12 preparation.
Driven by Data: Using licensure tests to build a strong, diverse teacher workforce
Content Knowledge Resources


July 2022
Digging Deeper: Which types of institutions achieve excellence and equity for aspiring teachers of color?
Building a more diverse teacher workforce is essential to addressing educational inequity for students of color. In this analysis, NCTQ considers teacher licensure test pass rate data through the lenses of excellence and racial equity,...

November 2021
Digging Deeper: Which subjects pose the greatest challenges to aspiring elementary teachers?
Elementary teachers have a big job. Unlike secondary teachers, they need to know not just one subject well, but four. Elementary teachers are expected to teach English language arts, math, science, and social studies—key content...
.png)
CONTENT KNOWLEDGE FAQs
How is content knowledge defined here?
This work focuses on core content areas needed by elementary teachers.1 The subjects taught by elementary teachers generally comprises English language arts (especially children's literature), science, social studies, and mathematics.2
While the specific standards that elementary teachers are expected to teach vary from state to state, there is a great deal of commonality. Forty-one states and D.C. have adopted the Common Core State Standards in math and English language arts,3 and 40 states and D.C. have adopted the Next Generation Science Standards (NGSS) or standards based on the framework from which the NGSS draws.4
REFERENCES
Elementary teachers are generally licensed for grades Kindergarten through fifth grade, although the specific grade span varies from state to state, with some starting as low as preschool and others reaching eighth grade.
These four areas are generally identified as the core elementary subjects by sources such as the IES Schools and Staffing Survey. (2012). Average number of hours and percentage of the student school week that regular full-time public school teachers of first through fourth grade in self-contained classrooms spent on each of four subjects, total instruction hours per week on four subjects, total time spent delivering all instruction per week, and average length of student school week: selected years 1987-1988 through 2011-2012. In U.S. Department of Education, National Center for Education Statistics, Schools and Staffing Survey. Retrieved from https://nces.ed.gov/surveys/sass/tables/sass1112_20161012001_t1n.asp
Common Core State Standards Initiative. (2021). Standards in your state.
Achieve. (2019). The state of state science education policy: Achieves 2018 science policy survey. Retrieved from https://www.nextgenscience.org/sites/default/files/Science%20Policy%20Survey%20Report_Final.pdf
Do licensure tests align with the content that teachers need to know?
The content knowledge assessed in licensure tests should reflect states' priorities. States are able to select the licensure tests that their incoming teachers must pass, and, in theory, select tests that best encompass the content they expect teachers to teach. States can use existing tests, such as the most commonly used Praxis Elementary Education: Multiple Subjects (5001) test, or they can work with a testing company to develop a new test or to modify an existing one.
Of course, no process is perfect. Some discrepancies between what teachers will teach and what is tested on licensure exams will likely exist. Moreover, the current elementary standards and teacher licensing tests likely do not fully reflect evolving thinking about what constitutes a diverse, representative curriculum. While more work may need to be done to ensure alignment among elementary standards, licensure tests, and an "ideal" curriculum, states have already taken the critical step of selecting the teacher licensure test that reflects their current expectations.
Why focus on content knowledge?
The full breadth of what teachers need to know and be able to do is expansive, and content knowledge is one of many crucial components. This project examines efforts to measure and develop aspiring teachers' content knowledge for three key reasons:
-
A broad base of content knowledge supports reading comprehension, another critical opportunity gap.
Much as learning phonics helps students decipher the sound of words, learning about a breadth of subject areas helps students draw meaning from what they read. A review of decades of research confirms that"higher levels of background knowledge enable children to better comprehend a text. Readers who have a strong knowledge of a particular topic, both in terms of quantity and quality of knowledge, are more able to comprehend a text than a similarly cohesive text for which they lack background knowledge."1Tests of students' reading comprehension reveal that their knowledge of the topic predicts their comprehension more accurately than their reading ability does.2 Moreover, spending more class time on social studies is associated with improved reading ability, especially for students who are learning English and for those from low-income backgrounds.3
-
Disparities in coursework that emphasize a breadth of content is another source of inequities for students of color and students from low-income backgrounds.
Learning core content builds the foundation for later grades and supports students' ability to enter postsecondary education. In a recent report on educational equity, the National Academies of Sciences identified "disparities in curricular breadth," in particular "availability and enrollment in coursework in the arts, social sciences, sciences, and technology" as a key indicator of educational inequities.4 Data from NAEP and other sources confirms a sizable opportunity gap in core content areas for students of color and students from low-income backgrounds.5 -
Elementary teachers themselves do not feel very well prepared to teach core content areas.
In a survey on behalf of the National Science Foundation, elementary teachers report feeling very well prepared to teach reading/ELA and mathematics, but feel less prepared when asked about specific mathematics subtopics. They do not feel well prepared to teach science or social studies, and their reported rates of preparedness have declined in all subjects between 2012 and 2018.6 Federal surveys of new teachers (not specific to elementary grades) find that only 37% report feeling very well prepared to teach their subject matter in their first year, and 31% were very well prepared to meet state content standards in their first year of teaching.7 While teachers may not know everything they will be expected to teach before they set foot in the classroom, they will be far more effective if they have a foundation in most of the content knowledge first.8 New research finds that having prior knowledge of a subject makes it easier to acquire new knowledge on that subject.9 Teachers need core content knowledge, and this knowledge cannot be assumed simply because they have earned a bachelor's degree.
Although a strong foundation in content knowledge is critical to effectiveness in the classroom, NCTQ recognizes that it is only a slice of what teachers need to know and do to be successful. Thus, while this project focuses on elementary content licensure tests, the analyses included here could be replicated for any type of assessment on any area, such as pass rates from performance assessments.
REFERENCES
Smith, R., Snow, P., Serry, T., & Hammond, L. (2021). The role of background knowledge in reading comprehension: A critical review. Reading Psychology, 42(2), 1-27.
Recht, D. R., & Leslie, L. (1988). Effect of prior knowledge on good and poor readers' memory of text. Journal of Educational Psychology, 80(1), 16; Schneider, W., Körkel, J., & Weinert, F. E. (1989). Domain-specific knowledge and memory performance: A comparison of high- and low-aptitude children. Journal of educational psychology, 81(3), 306; Smith, et al., 2021.
Tyner, A., & Kabourek, S. (2020). Social studies instruction and reading comprehension: Evidence from the early childhood longitudinal study. Thomas B. Fordham Institute. Retrieved from https://fordhaminstitute.org/national/resources/social-studies-instruction-and-reading-comprehension.
National Academies of Sciences, Engineering, and Medicine. (2019). Monitoring educational equity. Washington, DC: The National Academies Press. https://doi.org/10.17226/25389. Retrieved from https://www.nap.edu/catalog/25389/monitoring-educational-equity
For example, 2015 science assessment data finds that 51% of white students were proficient or advanced, compared with 15% of Black students and 21% of Hispanic students. This same year, 55% of students who were not eligible for the National School Lunch Program (NSLP) scored proficient or advanced, compared with only 22% who were eligible for the NSLP. National Center for Education Statistics. (2015). National Assessment of Educational Progress: 2015 science assessment. Washington, DC: National Center for Education Statistics, Institute of Education Sciences, U.S. Dept. of Education. Retrieved from https://www.nationsreportcard.gov/science_2015/#acl?grade=4
Banilower, et al. (2013). Report of the 2012 National Survey of Science and Mathematics Education. Horizon Research, Inc. Retrieved November 1, 2018, from https://eric.ed.gov/?id=ED541798; 2018 data from: Horizon Research, Inc. (2019). Highlights from the 2018 NSSME+. Chapel Hill, NC: Author. Retrieved from http://horizon-research.com/NSSME/wp-content/uploads/2019/01/Highlights-from-2018-NSSME.pdf
U.S. Department of Education, National Center for Education Statistics, Schools and Staffing Survey (SASS), "Public School Teacher Data File," 2011-2012. Retrieved from https://nces.ed.gov/surveys/sass/tables/sass1112_2016003_t1s.asp; U.S. Department of Education, National Center for Education Statistics, Schools and Staffing Survey (SASS), "Public School Teacher Data File," 2011-2012. Retrieved from https://nces.ed.gov/surveys/sass/tables/sass1112_2016008_t1s.asp
For example, several studies have found that teachers are better instructors on mathematics topics that they learned during teacher preparation. Suppa, S., DiNapoli, J., & Mixell, R. (2018). Teacher preparation "does" matter: Relationships between elementary mathematics content courses and graduates' analyses of teaching. Mathematics Teacher Education and Development, 20(2), 25-57. Hiebert, J., Berk, D., & Miller, E. (2017). Relationships between mathematics teacher preparation and graduates' analyses of classroom teaching. The Elementary School Journal, 117(4), 687-707.
Witherby, A. E., & Carpenter, S. K. (2021). The rich-get-richer effect: Prior knowledge predicts new learning of domain-relevant information. Journal of Experimental Psychology: Learning, Memory, and Cognition. Advance online publication
Who participated in surveys and focus groups on this issue?
To better understand the field's views, NCTQ conducted surveys and focus groups with leaders from state education agencies (SEAs) and teacher preparation programs. Surveys were developed by the National Council on Teacher Quality with input from the Content Matters Campaign Advisory Committee, which includes state leaders, educator prep faculty, and representatives from national advocacy organizations, among others. Surveys were sent to 52 leaders from state education agencies1 and were completed by 37 respondents representing 36 states. Surveys were sent to leaders of 986 teacher preparation programs and were completed by respondents from 202 different programs.
Focus groups were conducted with SEA and TPP leaders virtually in early December 2020. Two focus groups were conducted with each group, comprising 13 SEA leaders and 15 prep program participants, from a total of 24 different states. NCTQ and the Advisory Committee developed the focus group protocol and NCTQ conducted the focus groups.
REFERENCES
All states and D.C. were invited to participate, and one state requested that two people receive the survey.
What does the field think about the importance of elementary teachers' content knowledge?
Nearly everyone agrees that teachers cannot teach what they do not know. In total, 83% of teacher prep leaders (TPPs) and 95% of state education agency (SEA) leaders agreed with that statement.
The field shared a broad consensus that teachers should demonstrate content knowledge before they go into the classroom. Only a small minority of respondents assert that teachers can learn their content as they teach it (14% of prep program leaders and 5% of state education agency leaders). In some cases, those that assert that teachers can learn as they go recognize that doing so requires a well-developed curriculum, or that this process places an additional burden on teachers.
"Content knowledge does not predict the ability of effective instruction, it is a prerequisite for effective instruction." - SEA leader
"Robust instructional planning is required for effective instruction in any content area. Content knowledge plays such an important role in instructional planning--in making connections, in helping student delve deeply into content, in writing clear targets/objectives." - EPP leader
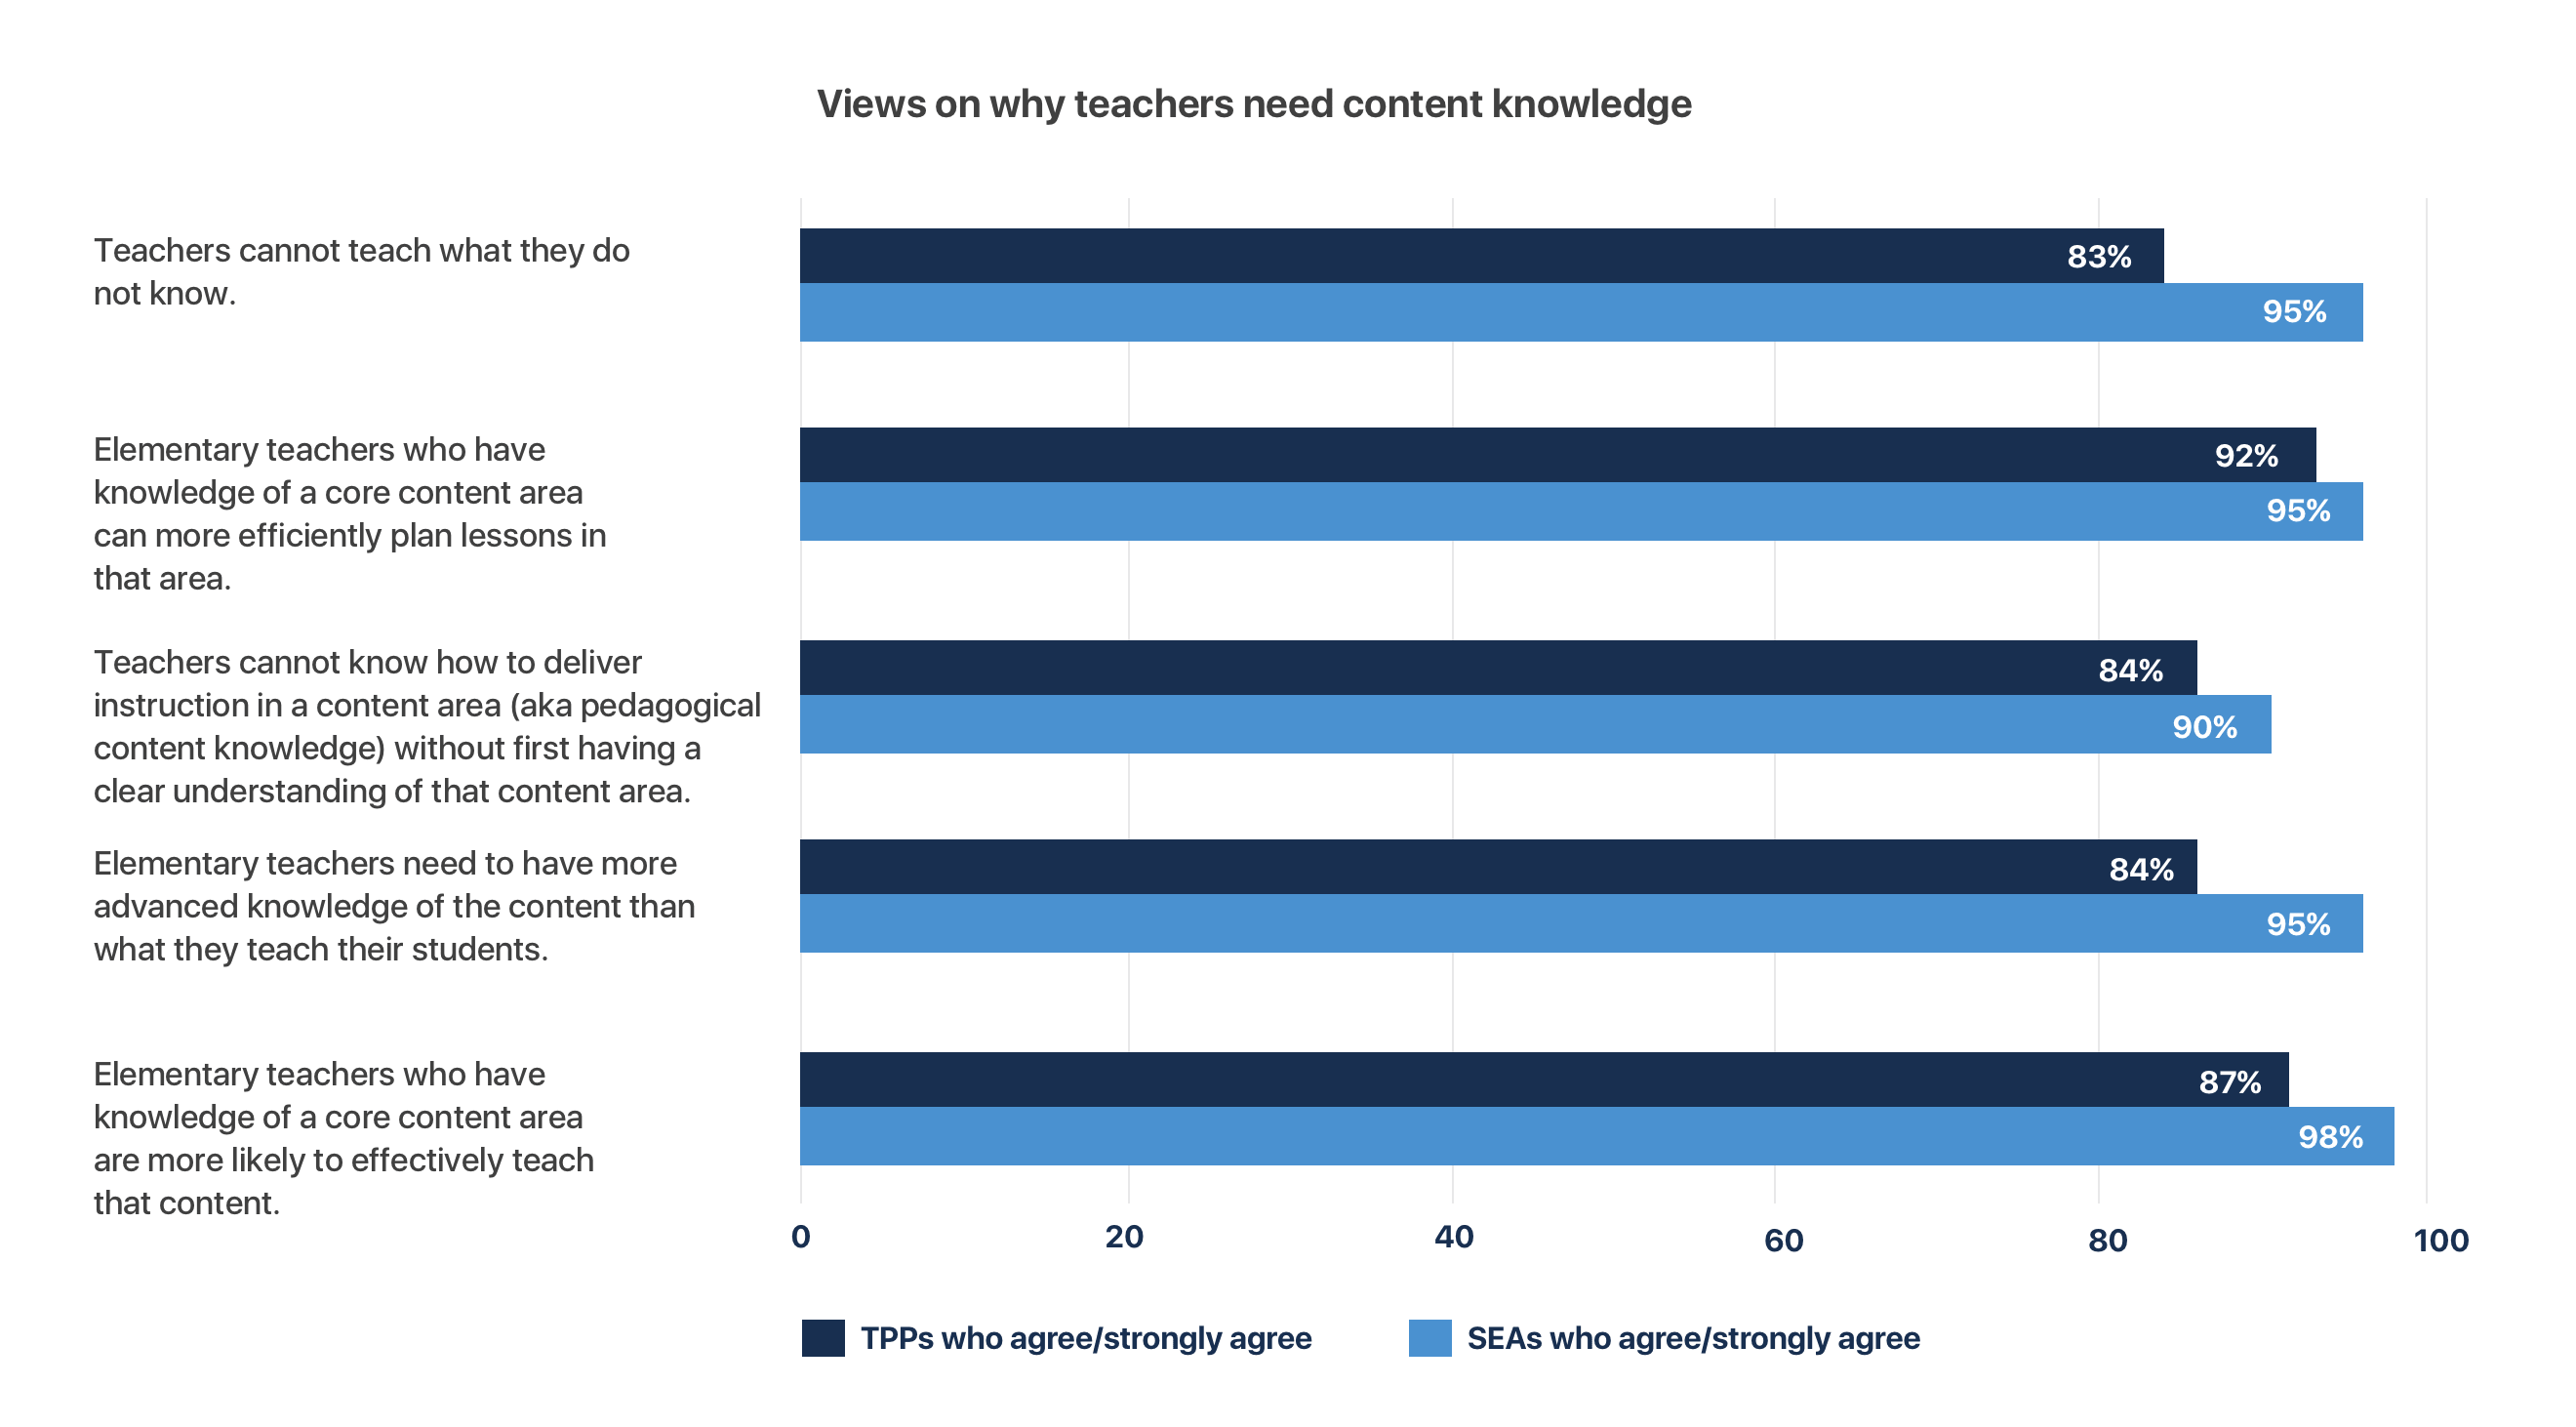
The field has more varied views on who is responsible for either teaching content or for verifying that candidates know core content before they earn licenses. Ideally, aspiring teachers would have learned much of the content by the time they received their high school diploma. However, the field agrees that a high school diploma does not always guarantee a firm grasp of content knowledge.1 In instances where completing high school has not ensured content knowledge, respondents think that aspiring teachers should learn core content while in college, either through their general education coursework (about 85% of respondents from both groups) or through their preparation program (57% of prep program leaders and 85% of state education leaders).
As for verifying that teachers know core content before they earn a teaching license, the plurality of respondents thought that either the preparation program or the state should be responsible (about a third of respondents from each group in each case).
Teachers agree on the importance of content knowledge.
An E4E survey2 found that nearly all (98%) of teachers said that prospective teachers should be able to demonstrate that they have the knowledge and skills necessary to teach in order to be licensed.
REFERENCES
About half of respondents (48% of prep program leaders and 54% of state education agency leaders) agree that the nation's K-12 education system adequately prepares students with the necessary knowledge of core content areas they would need if they went on to become elementary teachers.
Educators for Excellence. (2020). Voices from the classroom: A survey of America's educators. Retrieved from https://e4e.org/sites/default/files/voices_from_the_classroom_2020.pdf
What are the field's views on licensure tests and other means of assessing knowledge?
Licensure tests are favored by leaders from state education agencies more than by leaders from teacher prep programs. While states currently employ several means of assessing teachers' content knowledge, the most common is licensure tests. Forty-three states require elementary teacher candidates to pass a test of their content knowledge.1 The remaining eight states offer candidates an alternative to passing a licensure test, including having a degree or major in the content area or completing a content-based portfolio.
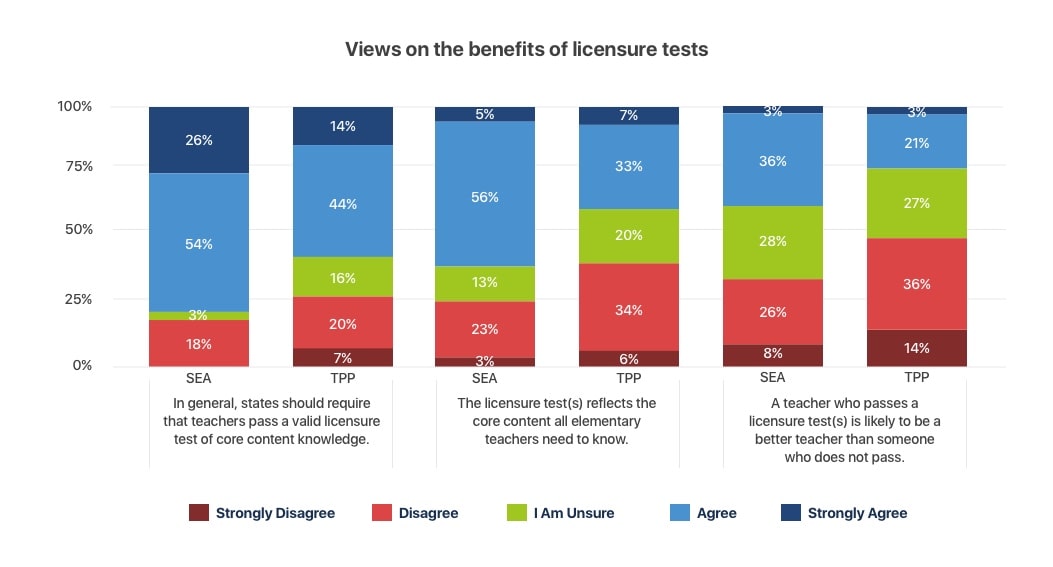
The plurality of state education agency (SEA) leaders believe that state licensure tests are very accurate (46%) and are the best tool to measure teacher candidates' content knowledge (45%). Teacher prep program (TPP) leaders tend to believe that completion of an accredited, approved preparation program is very accurate (45%, compared with 31% for state licensure tests) and are split on whether completion of a prep program (27%) or a state licensure test (25%) is the best measure.
It should not be a single assessment but multiple assessments to measure content knowledge. One element should not determine content knowledge. - EPP leader
For straight content knowledge, I think an assessment is best to ensure breadth and depth appropriate for teaching students at that level. Pedagogy would be a different measure and instruction would be different, but if it's about whether they know the content to teach students I would still go with an assessment of some kind. - SEA leader
In an ideal world, the core curriculum from any accredited college or university should suffice; however, there is great variability in the quality of educational institutions in our state so this is not necessarily viable. - EPP leader
On the whole, the field views licensing tests as an accurate, scalable means of measuring teacher candidates' content knowledge, albeit an imperfect one. The majority of respondents, 58% of prep program leaders and 79% of state education agency leaders, believe that states should require teachers to pass a valid licensure test.
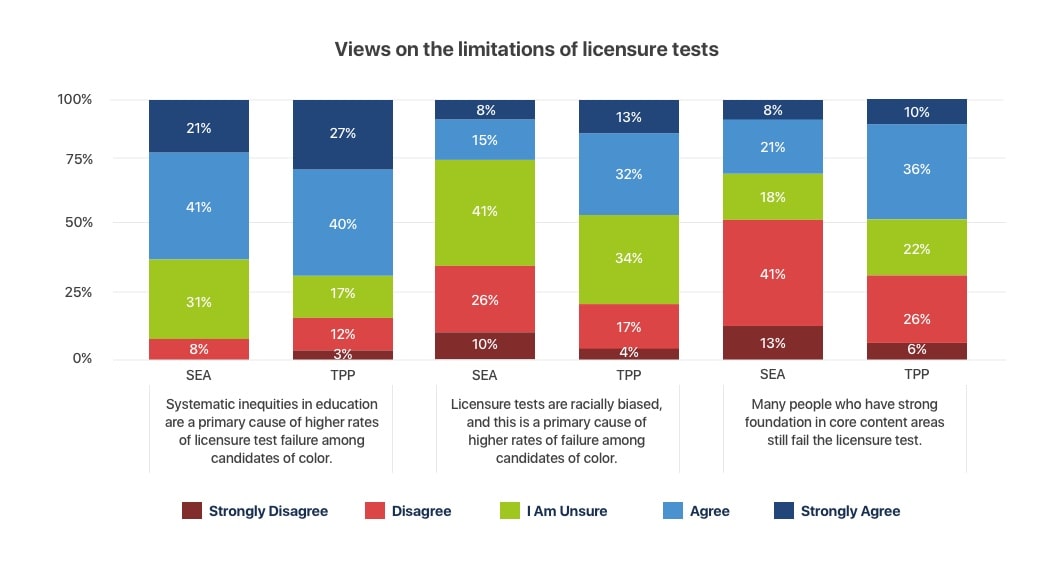
However, the field also holds some skepticism toward exams. While more respondents believe that systemic inequities in education drive the higher rates of failure among candidates of color, some identify bias in the tests themselves as a core cause of different passing rates. Leaders of teacher prep programs are also more likely to think that many people who have a strong foundation in core content areas still fail licensure tests.
Teachers' views of licensure tests are mixed but trend positive. An Educators for Excellence survey2 found that while only 32% said that their licensing test assessed knowledge and skills "very well," another 47% said the test did this "somewhat well." Only 4% said the test did not do this "well at all." A 2014 UFT (NYC Teachers Union) survey asked whether various reforms would be effective for improving educational outcomes for NYC students, and 73% of teachers said that licensing exams would be somewhat or highly effective.3
REFERENCES
National Council on Teacher Quality. (2020). Content knowledge national results. State Teacher Policy Database. [Data set]. Retrieved from: https://www.nctq.org/yearbook/national/Content-Knowledge-90
Educators for Excellence. (2020). Voices from the classroom: A survey of America's educators. Retrieved from https://e4e.org/sites/default/files/voices_from_the_classroom_2020.pdf
United Federation of Teachers. (2014). UFT annual teacher survey: Analysis of results. Retrieved from http://www.uft.org/files/attachments/annual-teacher-survey-2014.pdf
Do the field's views of licensure tests vary based on their familiarity with those tests?
Views toward licensure tests were more positive among respondents who considered themselves more familiar with the licensing test in their state. Two thirds of teacher prep leaders considered themselves "mostly" or "very" familiar with their state's licensing test. This group was more likely to think that their state's test reflected the core content elementary teachers need to know (45%, compared with only 18% among those who were "only a little" or "not at all" familiar with their state's test). This group was also more likely to believe the state should require a valid licensing test (62%, compared with only 50% of those with little familiarity with the state's test).
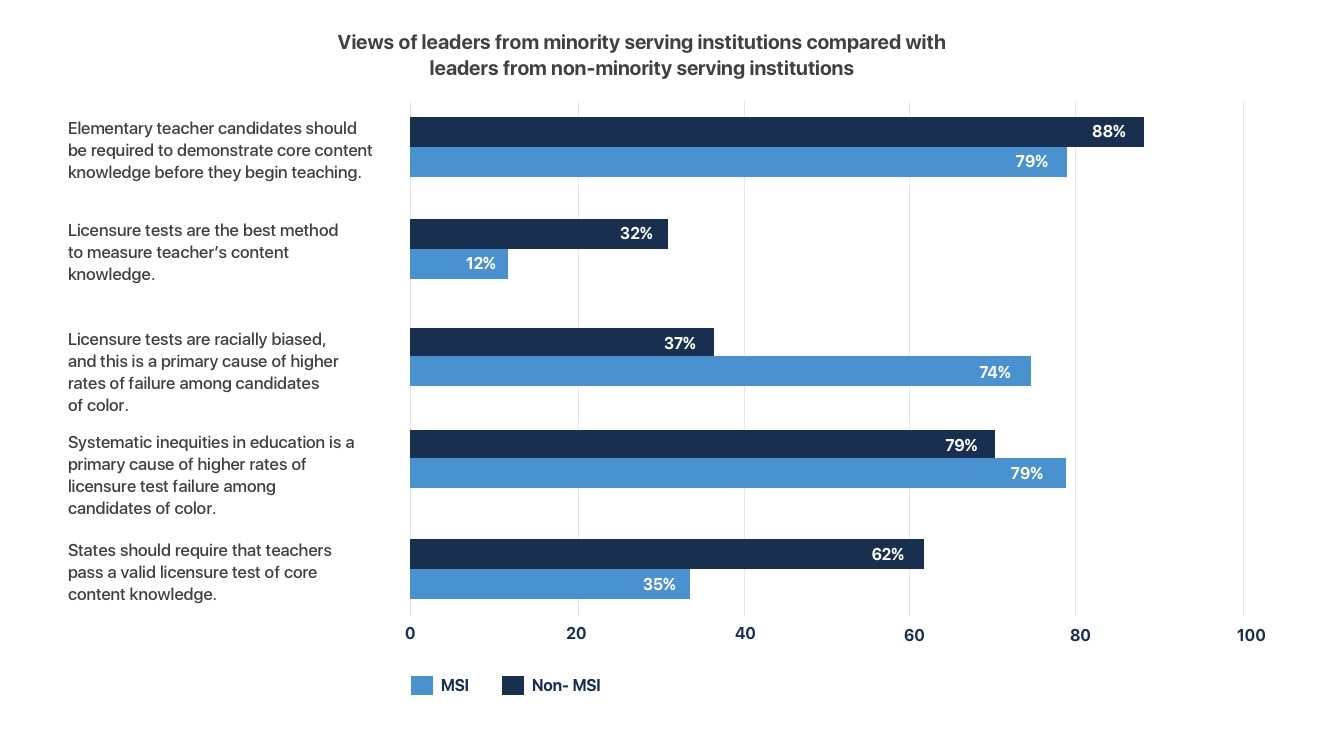
Do teacher prep leaders' views of licensure tests vary based on whether they lead a minority serving institution?
Leaders of minority-serving institutions (MSIs) shared similar views with other prep program leaders on the importance of teachers demonstrating content knowledge but were more skeptical of licensing tests than non-MSI respondents.1
REFERENCES
Of the 195 respondents who identified whether or not they were MSIs (or were unsure), 43 respondents (22%) identified as being from MSIs.
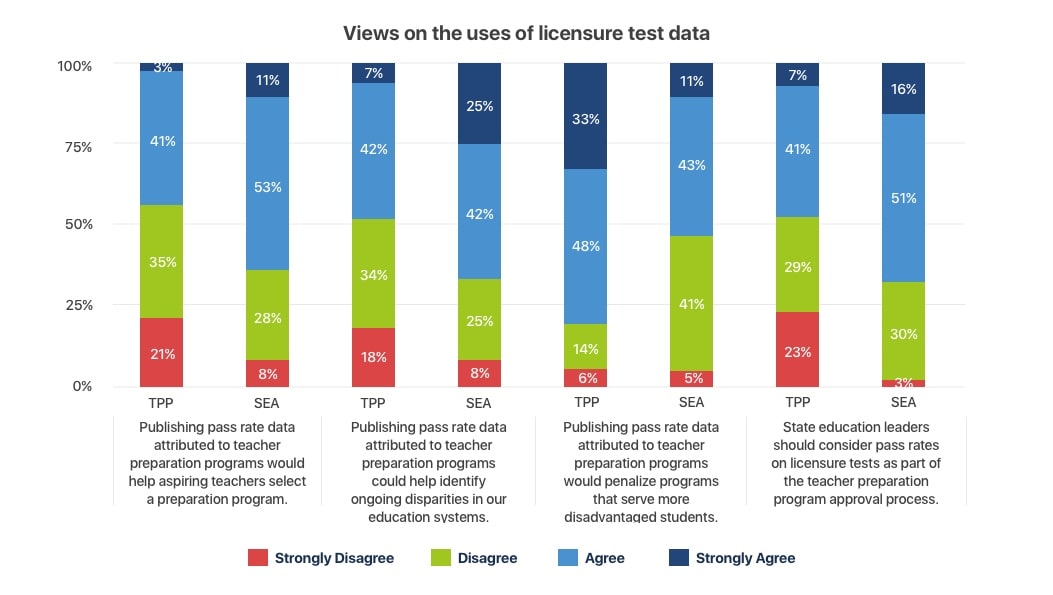
What are the field's views on publishing pass rate data?
Data from licensure tests may offer a powerful tool to identify systemic inequities in the educational system and to spotlight institutions that are helping their candidates succeed. Seventy percent of SEA leaders believe that pass rates should be published. In contrast, only 47% of prep program leaders believe that this data should be published, and this group is less likely to believe in the utility of this data.
Both groups share some concern that publishing pass rate data could penalize programs that serve more students from disadvantaged backgrounds, suggesting that contextual information should accompany pass rate data. During focus groups, many participants supported the idea of providing pass rate data with additional context. They asserted that providing pass rate data alongside information about students' socioeconomic background or racial demographics may provide a picture that is more "nuanced" or that gives "another layer" of information.
Participants from both the teacher prep program and state education agencies found the information about institutions that "broke the trend" in pass rates to be compelling.
"The publication of pass rates is fine, but only if the contexts are clear. Open institutions versus selective institutions, institutions that serve high numbers of ESL learners versus those that do not, etc." - EPP leader
"The review and analysis of pass rate data at the EPP and even state level could be a very valuable process - if it were done to better understand inequities and identify ways to support the preparation of teaching candidates. However, publishing this data holds strong potential for misunderstanding and misuse of the data." - EPP leader
How does the field believe data from licensure tests could be used?
Pass rate data as a metric for teacher prep program accountability. About half of EPP leaders (48%) and 68% of state education agency leaders agreed that the licensure test pass rates should be considered as part of a state's teacher preparation program approval process.
Pass rates as a source of consumer protection. Aspiring teachers may be better served by enrolling in preparation programs that have higher rates of success with teacher licensure tests, and so may benefit from access to this information. However, the field was somewhat skeptical about this idea: Only 44% of EPP leaders and 64% of SEA leaders agreed that it would be useful.
Pass rate data can highlight systemic inequities in the educational system, helping to prompt change. Support for this use of licensure tests was on par with using licensure test data for program accountability and consumer protection, with 48% of EPP leaders and 67% of SEA leaders in agreement.
In general, respondents seemed concerned that publishing data could penalize programs that serve students from disadvantaged backgrounds. This concern was greater among EPP leaders than SEA leaders.
"It is important to hold programs accountable at the state level (since that is how the current system works, rather than using national data) and even more important to use these results as a measure of program improvement, including Equity." - EPP leader
What alternative measures do states use to evaluate elementary candidates' content knowledge for licensure?
Twenty states offer elementary candidates alternative ways to demonstrate content knowledge, although it is not always clear whether states reviewed evidence on the validity of these proxy measures:
A degree or major in the content area (Arizona, California, Florida, Hawaii, Oregon, West Virginia), or a master's degree or higher (Arizona, Florida, Hawaii, Oklahoma, Oregon)
An exemption for candidates with a high GPA (in New Jersey, candidates with a 3.5 GPA or higher if they fail a licensing test by 5% or less, in Delaware candidates with a 3.5 GPA or higher if they fail a test with the "multiple measures" margin, and Montana and Wisconsin exempt those with a 3.0 or higher, and Maine has a GPA exemption, although the GPA is not specified)
Superintendent's recommendation if unable to pass licensure test within two years (Missouri)
Completion of a subject-matter preparation program (California, Oregon)
Content-based portfolio (Colorado, Maine, Montana, Wisconsin, and soon New Mexico)
Coursework in the content area (California, Colorado, Hawaii, Utah)
Passing a performance assessment (Colorado)
National Board Certification (Florida, Georgia, Hawaii, West Virginia)
Prior teaching experience and/or work experience in the subject area (Arizona, West Virginia)
Multiple-measures approaches that combine scores on a content test with other information (e.g., GPA, micro-credentials, course completion) (Alabama, California, Oregon) or that look at a combination of information that does not include licensure tests (Arkansas, Colorado, Delaware, Oregon, West Virginia)
What criteria should states consider in alternative measures to licensure tests?
Licensure tests are one of several ways to demonstrate content knowledge. When compared with many alternative measures, they are arguably more comparable, scaleable, efficient, reliable, and comprehensive than most. Currently, five states offer alternatives to licensure tests as a means to demonstrate content knowledge. However, it is not clear that these alternatives produce the same benefits as licensure tests.
When considering alternative measures, states should answer the following questions:
- How fully does this measure address the range of core content that candidates need to know? A measure should verify candidates' knowledge across a range of areas and not focus only on a single topic. For example, a performance assessment offers many benefits but may allow candidates to select a specific topic on which to teach a sample lesson. This narrow focus does not provide insight into candidates' knowledge of the broader range of core content. Similarly, the measure should be at the appropriate level of rigor, as teachers need to have a deeper conceptual understanding of the content than their students in order to teach content effectively.
- What is the time and cost burden to candidates? Licensure tests do not come cheap. The most commonly required elementary content test costs $200 for the first attempt and then $90 to retake any subtest afterward. Other approaches offer a range of costs. Portfolios require substantial time but may only require the cost of supplies (and perhaps not even that if done virtually). Performance assessments tend to be more costly than content licensure tests; the edTPA costs $300 for the first attempt and then between $100 to $300 for subsequent retakes.
- What is the time and cost burden for whoever reviews the assessment? The benefit of a standardized assessment is often that its grading is relatively automated, and expert reviewers may only need to score essay or short answer responses. However, more subjective or open-ended assessments, such as performance assessments, portfolios, or transcript reviews, may require a great deal of time in both training and scoring.
- How valid and reliable is the assessment? A measure of teachers' content knowledge should meet the basic properties of being valid (measuring the constructs that it intends to measure, in this case content knowledge rather than pedagogy, creativity, classroom management, etc.) and reliable (scoring is consistent over time, between raters, etc.). These expectations have been described in more detail by CAEP's criteria for assessments used by teacher preparation programs,1 but the same principles should apply to measures states use as well. Some forms of assessments, such as portfolio reviews, may be difficult to standardize so that they are valid and reliable measures. Others, such as formal performance assessments, may face reliability challenges despite being run by testing companies. For example, the edTPA has been critiqued as having insufficient reliability in its scoring process.2
- Does this assessment have potential bias or a differential impact for different groups of candidates? Licensure tests generally undergo a review to identify bias, both by examining the content of individual items and by reviewing outcomes on items to determine whether some questions tend to produce different outcomes among groups of test takers. Other assessments should undergo similar processes to ensure that the content of the assessment is not biased, and that the outcomes are not biased against some groups of test takers.3
As an example of how states investigate the quality of their licensure tests, Massachusetts has undertaken several initiatives to determine the predictive validity of its current licensure tests, as well as to evaluate possible alternatives.4
REFERENCES
Council for the Accreditation of Educator Preparation. (2017). CAEP evaluation framework for EPP-created assessments. Washington, DC: CAEP. Retrieved from http://caepnet.org/~/media/Files/caep/accreditation-resources/caep-assessment-tool.pdf?la=en; Regional Educational Laboratory at Marzano Research. (2019).Examining the reliability and validity of teacher candidate evaluation instruments [PowerPoint slides]. REL Central. Retrieved from https://ies.ed.gov/ncee/edlabs/regions/central/pdf/slides-reliability-and-validity.pdf
SCALE and Pearson refuted the concerns in a response, Stanford Center for Assessment, Learning and Equity. (2019). Affirming the validity and reliability of edTPA: A response authored by the Stanford Center for Assessment, Learning, and Equity (SCALE) and Pearson. Retrieved from http://edtpa.aacte.org/wp-content/uploads/2019/12/Affirming-Validity-and-Reliability-of-edTPA.pdf. In a follow-up article, Gitomer, Martínez, and Battey provided some additional context for their concerns, reiterated the limitations of the edTPA, and raised some new concerns about the Technical Advisory Committee. Gitomer, D. H., Martínez, J. F., & Battey, D. (2021). Who's assessing the assessment? The cautionary tale of the edTPA. Phi Delta Kappan, 102(6), 38-43. Retrieved from https://kappanonline.org/whos-assessing-assessment-cautionary-tale-edtpa-gitomer-martinez-battey/. An annual edTPA Administrative Report set to be released in summer 2021 intends to support the test's validity and reliability.
For example, a review of the edTPA found that Hispanic test takers systemically scored lower than white test takers. Goldhaber, D., Cowan, J., & Theobald, R. (2017). Evaluating prospective teachers: Testing the predictive validity of the edTPA. Journal of Teacher Education, 68(4), 377-393. Another study found that differences in scores between Black and white test takers were growing over time. Petchauer, E., Bowe, A. G., & Wilson, J. (2018). Winter is coming: Forecasting the impact of edTPA on Black teachers and teachers of color. The Urban Review, 50(2), 323-343. However, disparities in scores do not necessarily indicate bias in the instrument.
Cowan, J., Goldhaber, D., Jin, Z., & Theobald, R. (2020). Teacher licensure tests: Barrier or predictive tool? Working Paper No. 245-1020. National Center for Analysis of Longitudinal Data in Education Research (CALDER).
What are the hallmarks of a strong content licensure test?
- Alignment with the content that elementary teachers are expected to teach with adequate breadth and depth. Teachers need to know the content they will teach their students — and at least a bit more1 — so that they can build background knowledge and prepare their students for the next grade level. Elementary teachers are often certified for a range of grades (e.g., kindergarten through sixth grade) and therefore need to be familiar with core content across that entire range.
-
Separately scored core subject areas. In most cases, elementary teachers need to be prepared to teach all four core subject areas (and, in fact, elementary teachers are often less effective when they specialize in one or two subjects2). A strong licensure test should separately test and score each subject area (e.g., through a separate subtest devoted to each subject), and teachers should be required to pass each subject area's test. In the absence of these separate scores, it may be possible for a teacher's strength in one area to overshadow a severe weakness in another.3 Currently, only half of states require all elementary teachers to pass a test that meets this criterion.

- The minimum score to pass is aligned with expert recommendations. Standardized tests, including licensure tests, generally go through a "standard setting process," which uses aggregated judgements from experts to determine a recommended passing score. States can then choose where to set their own passing score, in light of that expert recommendation. As described by ETS, one of the two large testing companies,"Standard-setting studies serve two purposes. First, they are designed to identify the level of knowledge for a test taker to be considered minimally qualified for independent, beginning practice. The level of knowledge is represented by a minimum test score that test takers need to achieve. Second, the studies are designed to reconfirm the relevance (validity) of the test content for teachers in the adopting state."4
On tests developed by ETS, nearly all states follow the recommended passing score. On tests developed by Pearson, there is often less transparency around what the recommended passing score is because Pearson does not release any information (including recommended cut scores) public unless requested by the state education agency,5 and therefore it is less clear whether states are setting an appropriate passing score or not.
REFERENCES
Mitchell, R., & Barth, P. (1999). Not good enough: A content analysis of teacher licensing examinations. How teacher licensing tests fall short. Thinking K-16, 3(1), n1.
Bastian, K. C., & Fortner, C. K. (2020). Is less more? Subject-area specialization and outcomes in elementary schools. Education Finance and Policy, 15 (2), 357-382.
Jacobs, S. (2012). State of the states 2012: All quiet on the preparation front - Area 1: Delivering well-prepared teachers. NCTQ State Teacher Policy Yearbook Brief. Washington, DC: National Council on Teacher Quality. Retrieved July 26, 2018, from https://www.nctq.org/publications/State-of-the-States-2012:-All-Quiet-on-the-Preparation-Front----Area-1:-Delivering-Well--Prepared-Teachers;-NCTQ-State-Teacher-Policy-Yearbook-Brief
ETS. (2023). Standard-Setting Studies. ETS Praxis. Retrieved from https://www.ets.org/praxis/site/states-agencies/test-adoption/standard-setting-studies.html
L. Wilson, personal communication, April 22, 2021.
Do content licensure tests predict teachers' effectiveness?
Licensure tests of content knowledge are meant as a guardrail, ensuring that those who enter the classroom have an adequate level of knowledge about the topics they will be teaching. However, this knowledge is necessary but not sufficient for teachers to be effective; content knowledge is only one strand of the tapestry of effective teaching. Because these tests do not capture the complete picture of what makes an effective teacher, one would not expect these tests to be fully predictive of teachers' effectiveness, nor is that their role. However, it would be alarming if ample evidence indicated a negative relationship between passing licensing tests and teacher effectiveness, perhaps suggesting that these tests were blocking large numbers of effective would-be teachers from earning licenses.
To explore the full breadth of research on licensure tests, NCTQ identified thousands of potentially relevant studies published over the last three decades.1 Of these, only 15 were directly relevant to the question of whether licensure tests predict teacher effectiveness as measured by student outcomes. Of these, 11 found a statistically significant positive relationship between a teacher's test scores (or a binary measure of whether or not they passed the content licensure test) and that teacher's effectiveness in the classroom.2 The most recent study, examining MTEL tests in Massachusetts, found that not only did teachers' licensure test scores predict both teachers' value added scores and their evaluation ratings (and the latter was even more strongly predictive for teachers of color), but also that a one standard deviation increase in teachers' MTEL scores corresponded with an increase teacher performance ratings equivalent to about two thirds of the improvement between a first- and second-year teacher.3
Among the four remaining studies, one reported finding no statistically significant relationship between licensing test performance and effectiveness,4 although few in the study sample reported failing the licensure test on their first attempt, while four found a mixed effect.5 Hanushek's 1997 meta-analysis of research, asserted that about a third of the 41 included studies found a positive relationship between teacher test scores (though not necessarily content licensure test scores) and student achievement.6 The second found a positive correlation between passing the licensure test and teacher effectiveness in math, but warned that this relationship existed for white teachers but not Black teachers teaching Black students.7 The third found no relationship in most models, and a negative relationship between California's CSET exam and students' reading achievement.8
Interestingly, one recent study found that when cooperating teachers, the mentors who host teacher candidates for their student teaching placement, earned higher scores on their licensure tests, their student teachers went on to be higher-rated early career teachers.9
Of course, what is true of one licensing test may not hold for all tests or all contexts. For this reason, states should consider conducting an analysis of the predictive validity of their licensing tests, which could both strengthen the tests themselves and inform policy decisions around how to use them. Massachusetts commissioned such an analysis, finding a positive relationship between licensure test scores and several measures of teacher effectiveness (value-added and summative teacher performance ratings) and determining that the relationship held for both white teachers and teachers of color.10
REFERENCES
These studies were identified using combinations of the following search terms: "elementary content" "licens* test" "certification test" "teacher" "student outcomes" "elementary" "core subjects" "core knowledge" "outcomes" "student learning" "learning gains" "Praxis" "teacher effective" "race" "Black" "Latino" "Hispanic" "Latinx" "predictive validity" "predict*" "licensing" "certification" "Pearson"
Araujo P. M. D., Heineck, G., & Cruz Aguayo, Y. (2020). Does test-based teacher recruitment work in the developing world? Experimental evidence from Ecuador (No. 165). BERG Working Paper Series; Boyd, D., Lankford, H., Loeb, S., Rockoff, J., & Wyckoff, J. (2008). The narrowing gap in New York City teacher qualifications and its implications for student achievement in high-poverty schools (No. w14021). National Bureau of Economic Research; Chingos, M. M., & Peterson, P. E. (2011). It's easier to pick a good teacher than to train one: Familiar and new results on the correlates of teacher effectiveness. Economics of Education Review, 30(3), 449-465; Clotfelter, C. T., Ladd, H. F., & Vigdor, J. L. (2006). Teacher-student matching and the assessment of teacher effectiveness. The Journal of Human Resources, 41(4), 778-820; Clotfelter, C. T., Ladd, H. F., & Vigdor, J. L. (2007). How and why do teacher credentials matter for student achievement? (No. w12828). National Bureau of Economic Research; Ferguson, R. F. (1991). Paying for public education: New evidence on how and why money matters. Harvard Journal on Legislation, 28, 465-498; Goldhaber, D. (2007). Everyone's doing it, but what does teacher testing tell us about teacher effectiveness? Journal of human Resources, 42(4), 765-794; Cowan, J., Goldhaber, D., Jin, Z., & Theobald, R. (2020). Teacher licensure tests: Barrier or predictive tool? CALDER Working Paper No. 245-1020; Shuls, J. V., & Trivitt, J. R. (2012). What makes a teacher effective? An analysis of teacher credentials and student achievement. In Annual Conference Association for Education Finance and Policy, Boston, MA; Shuls, J. V., & Trivitt, J. R. (2015). Teacher effectiveness: An analysis of licensure screens. Educational Policy, 29(4), 645-675. Shuls, J. V. (2018). Raising the bar on teacher quality: Assessing the impact of increasing licensure exam cut-scores. Educational policy, 32(7), 969-992.
Goldhaber, D., Jin, Z., & Theobald, R. (2020).
Rockoff, J. E., Jacob, B. A., Kane, T. J., & Staiger, D. O. (2011). Can you recognize an effective teacher when you recruit one? Education Finance and Policy, 6(1), 43-74.
Hanushek, E. A. (1997). Assessing the effects of school resources on student performance: An update. Educational Evaluation and Policy Analysis, 19(2), 141-164; Goldhaber, D., & Hansen, M. (2010). Race, gender, and teacher testing: How informative a tool is teacher licensure testing? American Educational Research Journal, 47(1), 218-251; Shuls, J. V. (2018). Raising the bar on teacher quality: Assessing the impact of increasing licensure exam cut-scores. Educational Policy, 32(7), 969-992; Buddin, R., & Zamarro, G. (2009). Teacher qualifications and student achievement in urban elementary schools. Journal of Urban Economics, 66(2), 103-115.
Hanushek, E. A. (1997). Assessing the effects of school resources on student performance: An update. Educational Evaluation and Policy Analysis, 19(2), 141-164.
Goldhaber, D., & Hansen, M. (2010). Race, gender, and teacher testing: How informative a tool is teacher licensure testing? American Educational Research Journal, 47(1), 218-251.
Buddin, R., & Zamarro, G. (2009). Teacher qualifications and student achievement in urban elementary schools. Journal of Urban Economics, 66(2), 103-115.
This study found that a standard deviation increase in cooperating teachers' licensure test scores was associated with a positive and moderately statistically significant increase in early career teachers' evaluation ratings, and a positive but nonsignificant increase in value-added scores. Bastian, K. C., Patterson, K. M., & Carpenter, D. (2020). Placed for success: Which teachers benefit from high-quality student teaching placements? Educational Policy.
Cowan, J., Goldhaber, D., Jin, Z., & Theobald, R. (2020). Teacher licensure tests: Barrier or predictive tool? CALDER Working Paper No. 245-1020. Retrieved January 22, 2021, from https://caldercenter.org/publications/teacher-licensure-tests-barrier-or-predictive-tool
Why is composite pass rate data helpful?
Most states require an elementary content test that comprises several subtests, and aspiring teachers have to pass each subtest in order to pass the overall test and earn a license. While reporting data on each subtest is useful, especially in identifying the subjects that may require additional instruction, composite pass rate data, or the proportion of test takers who pass all subtests, is also critical.
Consider this scenario: A test has four subtests, and on each subtest, 80% of test takers pass. This could mean the composite pass rate is anywhere from 20% (if different test takers fail each subtest) to 80% (if the same test takers fail all four subtests). Knowing whether a state is losing 20% or 80% of its aspiring teachers (or some proportion in between) is very important for understanding the licensure test's role in the state's supply of teachers.
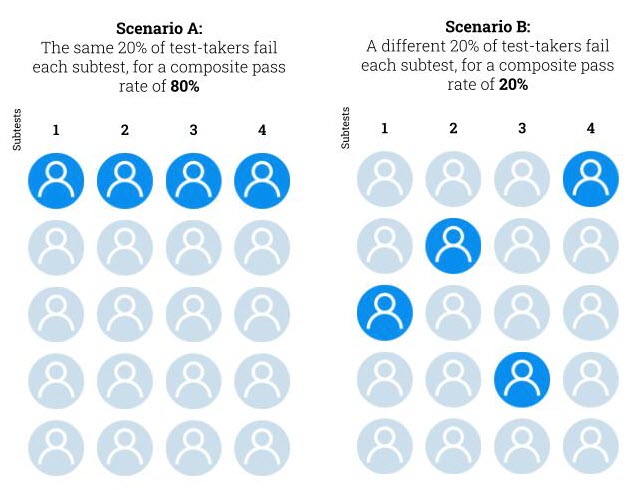
Advisory Committee
Dawn Basinger
Associate Dean for Academic Affairs
Louisiana Tech University
Mary Bivens
Director of Educator Development
Colorado Department of Education
Anika Burtin
Assistant Professor
Graduate Education Program, University of the District of Columbia
Abigail Cohen
Associate Director
Policy and Research, Data Quality Campaign
James Cibulka
Consultant/Former President
Council for the Accreditation of Educator Preparation
Edward Crowe
Chief Executive Officer
TPI-US
Eric Duncan
Senior Data and Policy Analyst
The Education Trust
Deb Eldridge
Director of Academic Engagement
Western Governors University
Cheryl Ensley
Interim Department Head
Curriculum and Instruction/Educational Leadership, Grambling State University
Emily Fox
Director
Educator Effectiveness, Illinois State Board of Education
Edith Gummer
Executive Director
Data Strategy, Arizona State University
Simone Hardeman-Jones
Founding Executive Director
GreenLight Twin Cities
Jerri Haynes
Dean
College of Education, Tennessee State University
Tanji Reed Marshall
Director of P-12 Practice
The Education Trust
Tiffany McDole
Senior Policy Analyst
Education Commission of the States
Jessica McLoughlin
Director of Educator Standards
Testing and Preparation, Texas Education Agency
Daniel Moore
Chief
Bureau of Educator Certification, Florida Department of Education
Daniel Robinson
Chair
Department of Curriculum and Instruction, University of Texas at Arlington
Debora Scheffel
Dean
School of Education, Colorado Christian University
Evan Stone
Co-founder and Co-CEO
Educators for Excellence
Crystal Timmons
Director of Office of Clinical and Field Experiences
Department of Education, Delaware State University
ABOUT EARLY READING
Pass rate data from early reading licensure tests offers an important tool to close opportunity gaps
Literacy is one of the human rights issues of our time. Students who learn to read in the elementary grades are more likely to finish high school1 and have far greater educational and career opportunities ahead of them. There is settled science about how to effectively teach reading so that nearly every child can read. Yet as of 2022, only one in three fourth graders reads proficiently,2 and literacy rates for nine-year-olds have dropped precipitously in the last few years.3 These literacy challenges persist into adulthood.4 Literacy rates are far lower for students of color: Less than a quarter of Hispanic students and a fifth of Black fourth grade students read proficiently.5
In the wake of the pandemic, children's reading challenges have grown considerably.6
To overcome these challenges, every aspiring elementary teacher should learn scientifically based reading instruction and be expected to demonstrate that knowledge before entering the classroom.
To help close the gaps for the students most affected by poor reading instruction, who are disproportionately students of color, it is especially important to support more teachers of color in entering the classroom and equipping those teachers with evidence-based reading methods. The research is clear that all students, and especially students of color, benefit from learning from teachers of color.
Despite decades of research confirming the best approach to teaching reading, not all preparation programs adhere to scientifically based reading instruction.7 Licensure tests offer a comprehensive, reliable, and efficient way for states to verify that teachers have this knowledge. Nearly every state requires elementary teachers to take a test on reading instruction before they become a teacher. But few states have published institution- or program-level pass rates on these tests, which can serve as a gauge of whether preparation programs are delivering instruction in this area.
Here, NCTQ is releasing a previously unavailable set of data that can help illuminate whether aspiring elementary teachers are being prepared to fulfill one of their most important responsibilities, teaching children to read. Having accurate, publicly accessible data is a foundational first step to improving pass rates and delivering better prepared teachers to the classroom.
This volume of early reading pass rate data illustrates how this data can be viewed through different lenses to gain insight into the quality of preparation, including persistence on the part of aspiring teachers, and commitment and innovation to overcome educational inequities and inadequate K-12 preparation to build a strong, diverse teacher workforce.
REFERENCES
Hernandez, D. J. (2011). Double jeopardy: How third-grade reading skills and poverty influence high school graduation. Washington, DC: Annie E. Casey Foundation.
U.S. Department of Education, Institute of Education Sciences, National Center for Education Statistics, National Assessment of Educational Progress (NAEP). (2022). NAEP Report Card: 2022 NAEP Reading Assessment. Retrieved from https://www.nationsreportcard.gov/highlights/reading/2022/.
This is based on the 2022 results from the National Assessment of Educational Progress's long-term trend data, which does not report achievement levels. U.S. Department of Education, Institute of Education Sciences, National Center for Education Statistics, National Assessment of Educational Progress (NAEP), 2020 and 2022 Long-Term Trend (LTT) Reading and Mathematics Assessments. Retrieved September 9, 2022, from https://www.nationsreportcard.gov/highlights/ltt/2022/
National Center for Education Research. (2020). Research on adult literacy: A history of investment in American adults. Inside IES Research. Retrieved from https://ies.ed.gov/blogs/research/post/research-on-adult-literacy-a-history-of-investment-in-american-adults
U.S. Department of Education, Institute of Education Sciences, National Center for Education Statistics, National Assessment of Educational Progress (NAEP). (2022). National achievement-level results. Retrieved from https://www.nationsreportcard.gov/reading/nation/achievement/?grade=4
Kuhfeld, M., Lewis, K., & Peltier, T. (2022). Reading achievement declines during the COVID-19 pandemic: Evidence from 5 million US students in grades 3-8. Reading and Writing, 1-17; Kuhfeld, M., Soland, J., & Lewis, K. (2022). The COVID-19 school year: Learning and recovery across 2020-2021. AERA Open. Retrieved from https://journals.sagepub.com/doi/pdf/10.1177/23328584221099306; Dorn, E., Hancock, B., Sarakatsannis, J., & Viruleg, E. (2021). COVID-19 and education: An emerging K-shaped recovery. McKinsey & Company. Retrieved March 3, 2022, from https://www.mckinsey.com/industries/education/our-insights/covid-19-and-education-an-emerging-k-shaped-recovery; Halloran, C., Jack, R., Okun, J. C., & Oster, E. (2021). Pandemic schooling mode and student test scores: Evidence from US states (No. w29497). National Bureau of Economic Research. Retrieved from https://www.nber.org/papers/w29497; U.S. Department of Education, Institute of Education Sciences, National Center for Education Statistics, National Assessment of Educational Progress (NAEP). (2022). 2020 and 2022 Long-Term Trend (LTT) Reading and Mathematics Assessments. Retrieved September 9, 2022, from https://www.nationsreportcard.gov/highlights/ltt/2022/.
Ellis, C., Holston, S., Drake, G., Putman, H., Swisher, A., & Peske, H. (2023). Teacher Prep Review: Strengthening Elementary Reading Instruction. Washington, DC: National Council on Teacher Quality. https://www.nctq.org/review/standard/Reading-Foundations
EARLY READING FAQs
How is scientifically based reading instruction defined?
Scientifically based reading instruction, also referred to as the science of reading, is a vast, interdisciplinary body of scientifically based research about reading and issues related to reading and writing.1
This research has been conducted across the world over the last five decades and is derived from thousands of studies conducted in multiple languages. The science of reading has culminated in a preponderance of evidence to inform 1) how proficient reading and writing develop; 2) why some students have difficulty learning to read; and 3) how we can most effectively teach and assess progress in reading and, therefore, improve student outcomes through prevention of, and intervention to address, reading difficulties.
The "simple view of reading" asserts that reading comprehension results from word recognition and language comprehension. This view is illustrated by the Simple View graphic (below) that clearly shows that Word Recognition multiplied by Language Comprehension = Reading Comprehension.
In this equation, both Word Recognition (WR) and Language Comprehension (LC) are essential; if either multiplier is zero, the result is zero.
Another explanation of the components that lead to reading comprehension is "Scarborough's reading rope," which the national organization The Reading League refers to as a "visual metaphor for the development of skills over time (represented by the strands of the rope) that lead to skilled reading."2
Reprinted from Scarborough, H. S., Neuman, S., & Dickinson, D. (2009). Connecting early language and literacy to later reading (dis) abilities: Evidence, theory, and practice. Approaching Difficulties in Literacy Development: Assessment, Pedagogy and Programmes, 10, 23-38.
Language comprehension is "the ability to extract and construct literal and inferred meaning from linguistic discourse represented in speech" and includes drawing from background knowledge and an understanding of how language works (phonological knowledge, syntactic knowledge, and semantic knowledge). Word recognition is "the ability to recognize printed words accurately and quickly to efficiently gain access to the appropriate word meanings" and includes the knowledge of alphabetic principles, including phonemic awareness, and concepts about print.3 This "simple view of reading" has been validated by over 150 scientific studies.4
Based on the work of our expert panel and the research on the science of reading, NCTQ bases the evaluation of teacher preparation programs and licensure tests on the coverage of the five core components of reading: phonemic awareness, phonics, fluency, vocabulary, and comprehension. Analysts look for evidence of these five components when analyzing teacher preparation programs' instruction in the science of reading, and when analyzing the breadth and depth of licensure tests' assessment of aspiring teachers' knowledge of the science of reading.
REFERENCES
The definition presented here was created by a group of researchers and practitioners. More information is available at https://www.thereadingleague.org/what-is-the-science-of-reading/
The Reading League. (2022). Science of reading: Defining guide. Retrieved from https://www.thereadingleague.org/wp-content/uploads/2022/03/Science-of-Reading-eBook-2022.pdf
Hoover, W. A., & Tunmer, W. E. (2022). The primacy of science in communicating advances in the science of reading. Reading Research Quarterly, 57(2), 399-408.
The Reading League. (2022).
Why focus on early reading?
Literacy is the bedrock for later learning and for many life outcomes. The expression that until third grade, students "learn to read," and after that they "read to learn," has a fair bit of truth. Research finds that, "a child who cannot read proficiently by third grade is four times as likely to leave high school without a diploma than proficient readers."1 These rates are compounded when children come from low-income backgrounds.2 But these challenges need not be a child's destiny: With effective reading instruction, nearly every child can learn to read. Estimates suggest that effective instruction can bring the rate of reading failure down to less than 10%, or perhaps even as low as 2 to 6%.3
REFERENCES
Hernandez, D. J. (2011). Double jeopardy: How third-grade reading skills and poverty influence high school graduation. Washington, DC: Annie E. Casey Foundation.
Hernandez, D. J. (2011).
Lyon, G. R. (1998). Overview of reading and literacy initiatives (Report to Committee on Labor and Human Resources, U.S. Senate). Bethesda, MD: National Institute of Child Health and Human Development, National Institutes of Health; Torgesen, J. K. (1998). Catch them before they fall: Identification and assessment to prevent reading failure in young children. American Educator, 22(1-2), 32-39. www.aft.org/sites/default/files/periodicals/torgesen.pdf; Torgesen, J. K. (2000). Individual differences in response to early interventions in reading: The lingering problem of treatment resisters. Learning Disabilities Research & Practice, 15(1), 55-64; Torgesen, J. K. (2004). Preventing early reading failure. American Educator, 28(3), 6-9; Vellutino, F. R., Fletcher, J. M., Snowling, M. J., & Scanlon, D. M. (2004). Specific reading disability (dyslexia): What have we learned in the past four decades? Journal of Child Psychology and Psychiatry, 45(1), 2-40. http://dr-hatfield.com/educ538/docs/Vellutino,+etal+2004.pdf; Al Otaiba, S., & Fuchs, D. (2006). Who are the young children for whom best practices in reading are ineffective? An experimental and longitudinal study. Journal of Learning Disabilities, 39(5), 414-431.
Why are state dashboards being released on a rolling basis?
The Early Reading dashboards are being released on a rolling basis for several reasons.
First, many states have changed tests over the last few years. When possible, NCTQ seeks to provide data on the test currently in use. To have adequate data, a state would ideally have fielded the test for at least two years, and many states need additional time to work with testing companies and teacher preparation programs to gather and "clean" the data. Consequently, with the exception of tests that were only eliminated in 2022, NCTQ is waiting until a test has been in use for several years before requesting data.
Second, NCTQ is working to identify solutions based on available data (e.g., the rosters used for Title II pass rate verification) to gather pass rate data specific to teacher candidates, rather than for all test takers in the state. Limiting the data to only program candidates, which the testing companies can do upon request from state education agencies, is more time- and resource-intensive, and so the testing companies completing this work can only do so on a rolling basis.
What purpose do early reading licensure tests serve?
Licensure tests act as a verification that teachers have this critical knowledge base before they become responsible for a class of students. Other safeguards, such as requiring candidates to complete an approved teacher preparation program or expecting teachers to follow a reading curriculum selected by their district or state, have so far not proven effective enough.
While many aspiring teachers come to the classroom after completing an approved teacher preparation program, research suggests that completing a preparation program does not guarantee that aspiring teachers have learned how to teach reading. For example, researchers have assessed the knowledge of reading instruction and language constructs for teacher educators who provide reading instruction to aspiring elementary teachers and have found that many of these teacher educators, in the words of one study, "do not possess a good understanding of basic language constructs."1 Another study concluded that teacher educators who teach reading instruction need additional professional development.2 Further, research finds that the textbooks commonly required by reading courses for elementary candidates often do not adequately address the five components of reading as outlined by the National Reading Panel.3
Similarly, while reviews by the National Council on Teacher Quality (NCTQ) have found that teacher prep programs have improved in teaching scientifically based reading instruction over the last decade, many programs still fall short of teaching the core components of reading.4 NCTQ recently found that only 25% of teacher prep programs taught aspiring elementary teachers the five core components of reading instruction.5
Confirming these findings, numerous studies have surveyed practicing teachers and found substantial gaps in their knowledge of scientifically based reading instruction.6 Reporting by Emily Hanford has provided example after example of teachers who reach the classroom uninformed or worse, misinformed, about how to teach reading.7 In fact, a Facebook group, "Science of Reading - What I should have learned in college" is 175,800 members strong, and many states have local chapters of this group as well, clear evidence that teachers are frustrated by gaps in their own learning about scientifically based reading instruction.
And once they reach the classroom, teachers are often not equipped with the tools to help their children succeed. EdReports, a nonprofit that reviews instructional materials, gave low marks to two of the nation's most popular literacy curricula, Fountas & Pinnell Classroom8 and Teachers College Units of Study,9 thereby perpetuating reading strategies that are not neutral but have negative impacts on student learning.10
REFERENCES
Binks-Cantrell, E., Washburn, E. K., Joshi, R. M., & Hougen, M. (2012). Peter effect in the preparation of reading teachers. Scientific Studies of Reading, 16(6), 526-536.
Joshi, R.M., Binks, E., Hougen, M., Dahlgren, M. E., Ocker-Dean, E., & Smith, D. L. (2009). Why elementary teachers might be inadequately prepared to teach reading. Journal of Learning Disabilities, 42(5), 392-402.
Malatesha Joshi, R., Binks, E., Graham, L., Ocker-Dean, E., Smith, D. L., & Boulware-Gooden, R. (2009). Do textbooks used in university reading education courses conform to the instructional recommendations of the National Reading Panel? Journal of Learning Disabilities, 42(5), 458-463.
Ellis, C., Holston, S., Drake, G., Putman, H., Swisher, A., & Peske, H. (2023). Teacher Prep Review: Strengthening Elementary Reading Instruction. Washington, DC: National Council on Teacher Quality. https://www.nctq.org/review/standard/Reading-Foundations.Ellis, C., Holston, S., Drake, G., Putman, H., Swisher, A., & Peske, H. (2023).
Ellis, C., Holston, S., Drake, G., Putman, H., Swisher, A., & Peske, H. (2023).
For example, Moats, L. (2009). Knowledge foundations for teaching reading and spelling. Reading and Writing, 22(4), 379-399; Lane, H. B., Hudson, R. F., Leite, W. L., Kosanovich, M. L., Strout, M. T., Fenty, N. S., & Wright, T. L. (2008). Teacher knowledge about reading fluency and indicators of students' fluency growth in reading first schools. Reading & Writing Quarterly, 25(1), 57-86; Washburn, E. K., Malatesha Joshi, R., & Binks-Cantrell, E. S. (2011). Teacher knowledge of basic language concepts and dyslexia. Dyslexia, 17(2), 165-183; Cheesman, E. A., McGuire, J. M., Shankweiler, D., & Coyne, M. (2009). First-year teacher knowledge of phonemic awareness and its instruction. Teacher Education and Special Education, 32(3), 270-289.
Hanford, E. (2018). Hard words: Why aren't kids being taught to read. APM Reports, 9-16; Hanford, E. (2019). At a loss for words: How a flawed idea is teaching millions of kids to be poor readers. APM Reports; Hanford, E. (2020). What the words say: Many kids struggle with reading—and children of color are far less likely to get the help they need. APM Reports.
EdReports. (2020). Fountas and Pinnell Classroom. Retrieved from https://www.edreports.org/reports/overview/fountas-pinnell-classroom-2020
EdReports. (2018). Units of Study. Retrieved from https://www.edreports.org/reports/overview/units-of-study-2018
Theobald, R. J., Goldhaber, D. D., Holden, K. L., & Stein, M. L. (2022). Special education teacher preparation, literacy instructional alignment, and reading achievement for students with high-incidence disabilities. Exceptional Children, 00144029221081236.
Can states accomplish the same end by mandating that prep programs teach the science of reading and not require a licensure test?
States' standards for preparation programs are important. Explicitly defining the reading instruction that states expect their preparation programs to impart sends a clear signal to their programs about what matters and provides guidelines that can be used in program accountability. However, state standards are an input that, without oversight, may not always be sufficiently reflected in preparation programs' practice. While 32 states require preparation programs to address the components of the science of reading instruction,1 only three of those states' preparation programs address at least four of the five core components of reading instruction (on average).2 A recent review found that in 20 states that had strong teacher prep standards but an inadequate or no licensure test, at least half of preparation programs did not adhere to the states' standards in reading.3
REFERENCES
National Council on Teacher Quality. (2021). Teaching reading national results. State Teacher Policy Database. [Data set]. Retrieved from https://www.nctq.org/yearbook/national/Teaching-Reading-90
Ellis, C., Holston, S., Drake, G., Putman, H., Swisher, A., & Peske, H. (2023). Teacher Prep Review: Strengthening Elementary Reading Instruction. Washington, DC: National Council on Teacher Quality. https://www.nctq.org/review/standard/Reading-Foundations
Ross, E. (2018). NCTQ databurst: Strengthening reading instruction through better preparation of elementary and special education teachers. National Council on Teacher Quality. Retrieved from https://www.nctq.org/dmsView/Strengthening_Reading_Instruction_Databurst
Do licensure tests measure the science of reading?
There are currently more than 30 licensure tests that include an assessment of reading instruction to some extent; these tests are not uniformly high quality. About a third of them (11 tests) do give adequate attention to the five core components of reading instruction: phonics, phonemic awareness, fluency, vocabulary, and comprehension. Another 15 tests adequately assess some but not all components, five licensure tests combine reading with all other subjects and so cannot adequately gauge teachers' knowledge in this area, and one adequately addresses the five components of reading but also assesses candidates on numerous areas contrary to research-based practices.
What alternative measures do states use to evaluate elementary candidates' knowledge of how to teach reading?
Several states require a licensure test in early reading but also provide exemptions or alternative ways of satisfying this requirement1.
Hawaii, which requires a test that only measures some components of scientifically based reading instruction also allows several alternative options: National Board for Professional Teaching Standards certification in the content field; a content major consisting of at least 30 semester hours in the content field (at least 15 semester hours must be upper division level); a master's, specialist or doctoral degree in the license field; or at least thirty-six semester hours, (including nine semester hours in each core content area; at least three semester hours in each core content area must be upper division level).
Idaho requires that candidates pass the Praxis 5001 or 7811 (neither of which adequately assess all core components of reading), as well as the state's "Comprehensive Literacy Assessment," however, this assessment does not refer to a single mandated assessment but rather a process through which preparation programs must verify that candidates know how to teach reading. The state does offer a four-part assessment, which many preparation programs use as part of their reading coursework. However, programs can also develop their own assessment or measure candidates' knowledge through project-based work or other means.
Maine, which also has a test of reading in place that does not adequately address the five core components of reading, allows candidates to instead meet a minimum grade point average or complete a portfolio review based on academic or work experience.
Oregon (which also has test of reading in place which assesses the five core components of reading but combines reading with another subject), provides several alternative options: a bachelor's degree or higher in the endorsement area, or a score of 70 or higher on the Teacher Standards and Practice's Commission (TSPC) content preparation matrix. The matrix factors in scores from the applicable content test.
Several states require licensure tests that address reading to at least a limited extent, but allow flexibility if candidates do not pass the test: Missouri allows a superintendent's recommendation and New Jersey allows an exemption to candidates who failed the test by five percent or less if they have a high GPA.
North Carolina requires a test that fully addresses the five components of reading; however, the state allows candidates three years to pass the test as long as it is attempted in the first year of licensure.
Further, Iowa does not require a test that addresses knowledge of research-based reading practices.
REFERENCES
Citation: National Council on Teacher Quality. (2021). Teaching Reading National Results. State Teacher Policy Database. [Data set]. Retrieved from: https://www.nctq.org/yearbook/national/Teaching-Reading-90
What are the hallmarks of a strong early reading licensure test?
A strong early reading licensure test is one that aligns with the consensus scientific research about how a teacher can help the most students become successful readers. There are three fundamental guiding principles by which one can assess this:
- Are each of the five elements of the scientifically based reading instruction (phonemic awareness, fluency, phonics, vocabulary, and comprehension) adequately assessed in the test?
- Does the test exclude content that is contrary to scientifically based reading instruction (e.g., three cueing system)?
- Is the test (or subtest) dedicated to reading (or English language arts), rather than combining reading with other subjects like social studies or math?
Using these guiding questions, NCTQ completed a review of states' teacher licensure exams to determine the degree to which each test aligns with the consensus on the scientific research about how a teacher can help the most students become successful readers.
Both commercial test publishers and states that create their own tests publish the tests' content areas and objectives online. In the course of assessing the adequacy of exams, NCTQ accessed publicly available materials, including content outlines, test objectives, and the publisher's candidate test prep materials including sample tests (often available for purchase). NCTQ has also been asked to review several commercially published licensure exams ahead of their release, gaining additional insight into their content.
Do reading licensure tests predict teachers' effectiveness?
Licensure tests of knowledge of scientifically based reading instruction are meant as a guardrail, ensuring that those who enter the classroom have an adequate level of knowledge about how to teach reading, undoubtedly one of the most important jobs of an elementary student.
While a robust body of research has examined the predictive validity of content licensure tests (for elementary teachers, these usually include social studies, science, mathematics, and English language arts), little research has focused on tests of scientifically based reading instruction specifically. However, several of the content licensure tests that were studied do include a subtest that comprises both English language arts and reading. For example, the Florida Teacher Certification Exam includes items on reading; a 2011 study found a moderately strong positive relationship between teachers' performance on the certification exam and their effectiveness in the classroom as measured by student outcomes, including for grades 6-8 reading scores, although not for grades 4-5.1
Scant research has focused specifically on licensure tests of scientifically based reading instruction. One analysis of data in Wisconsin found that the Foundations of Reading exam was predictive of teacher effectiveness as measured by one evaluation framework (the Stronge framework) but not another (the Framework for Teaching, commonly referred to as the Danielson framework).2
However, several studies have used a Teacher Knowledge Survey (TKS) that was designed based on the Foundations of Reading licensure exam (a test of knowledge of scientifically based reading instruction that is widely regarded as a strong test; 11 states currently require this test3).4 These studies have found a relationship between teachers' performance on the TKS and their effectiveness in the classroom.
One study found that teachers who scored higher on the TKS in phonemic awareness and phonics devoted more instructional time to phonemic awareness, phonics, and the composite letter knowledge/phonics variable; teachers' higher scores on fluency, vocabulary, and comprehension were associated with more time on oral language and literature (although the latter were also associated with less time on basic writing skills, vocabulary, or reading comprehension).5 A study of two school districts found that teachers' scores on the TKS were significantly associated with "Broad Reading achievement" at both sites, and with year-end scores at one site but not the other (which the authors hypothesized was because at the second site, the teachers had all scored near the ceiling for the test).6
A synthesis of research concluded that:
"a small group of studies converges on these points: a) teachers' knowledge of phonology and orthography7 often appears to be underdeveloped for the purpose of explicit teaching of reading or writing; b) teacher content knowledge of language can be measured directly but is not closely associated with philosophical beliefs or knowledge of children's literature; and c) teachers' knowledge of and ability to apply concepts of phonology and orthography accounts for significant variance in young children's reading and spelling achievement, but this relationship has been more difficult to demonstrate as students move beyond early reading."8
Another review of 20 research studies focused on the connection between teacher preparation and teacher knowledge concluded, "the limited studies in this review provided initial evidence that improving teacher knowledge and providing support for the implementation of new knowledge may lead to improved student word-level outcomes (e.g., letter sounds, reading and spelling regular words, nonword-reading fluency, oral reading fluency)."9 The study could not extend this finding to reading comprehension because of the dearth of studies it identified on that topic.
Another study adds an interesting twist to this research. This study, conducted with schools in Florida in the 2005-2006 school year, used a different assessment of teachers' knowledge created specifically for this study, but based on surveys used in other studies.10 This research found that when teachers had high knowledge of scientifically based reading, and they spent more time on explicit decoding instruction, their students gained a great deal in reading scores. However, if teachers had low knowledge, the more time teachers spent on explicit decoding instruction, the weaker their student reading score gains were. This suggests that while teacher knowledge alone does not predict student outcomes (since teachers also must devote instructional time to teaching reading), having low knowledge does harm to students. The study concluded that "teachers with low knowledge scores who persisted in providing large amounts of decoding instruction tended to produce weaker reading skill growth in students than if the teacher had not provided any explicit decoding instruction at all," often because teachers provided inaccurate examples, were unable to correct student errors, and provided less varied and comprehensive instruction.11
Another study using a different survey of teachers' linguistic knowledge found that students of teachers with linguistic knowledge scores one standard deviation above the mean had a considerable advantage in vocabulary, narrative composition, spelling, and word identification (although no advantage for comprehension or fluency) compared with students whose teachers scored at the mean.12
In sum, while this is an area ripe for further research, the available evidence strongly suggests that various measures of teachers' knowledge of scientifically based reading instruction do correlate with their students' reading achievement gains.
REFERENCES
Chingos, M. M., & Peterson, P. E. (2011). It's easier to pick a good teacher than to train one: Familiar and new results on the correlates of teacher effectiveness. Economics of Education Review, 30(3), 449-465.
This study also noted that no extant research could be found on the Foundations of Reading's predictive validity. Jones, C., & Bales, B. (2020). The utility and cost of requiring Wisconsin teachers pass the FoRT and edTPA assessments. The Office of Socially Responsible Evaluation in Education at the University of Wisconsin Milwaukee. Retrieved from https://uwm.edu/sreed/wp-content/uploads/sites/502/2020/03/fort-edtpa-presentation.pdf
Alabama, Arizona, Arkansas, Connecticut, Massachusetts, Mississippi, New Hampshire, North Carolina, Ohio, Utah, and Wisconsin.
Spear-Swerling, L., & Zibulsky, J. (2014). Making time for literacy: Teacher knowledge and time allocation in instructional planning. Reading and Writing, 27(8), 1353-1378.
Spear-Swerling, L., & Zibulsky, J. (2014).
Moats, L. C., & Foorman, B. R. (2003). Measuring teachers' content knowledge of language and reading. Annals of Dyslexia, 53(1), 23-45.
Phonology refers to "the sound structure of language. Phonology tasks are auditory/oral tasks that focus on students' ability to articulate the sounds of language, without involving letter or word knowledge." Foorman, B., Beyler, N., Borradaile, K., Coyne, M., Denton, C. A., Dimino, J., Furgeson, J., Hayes, L., Henke, J., Justice, L., Keating, B., Lewis, W., Sattar, S., Streke, A., Wagner, R., & Wissel, S. (2016). Foundational skills to support reading for understanding in kindergarten through 3rd grade (NCEE 2016-4008). Washington, DC: National Center for Education Evaluation and Regional Assistance (NCEE), Institute of Education Sciences, U.S. Department of Education. Retrieved from the NCEE website: http://whatworks.ed.gov. Orthography refers to "orthographic knowledge (i.e., the knowledge about permissible letter patterns). It consists of two components, word-specific (i.e., the knowledge of the spelling of specific words) and general orthographic knowledge (i.e., the knowledge about legal letter patterns of a writing system)." Zaric, J., Hasselhorn, M., & Nagler, T. (2021). Orthographic knowledge predicts reading and spelling skills over and above general intelligence and phonological awareness. European Journal of Psychology of Education, 36(1), 21-43.
Moats, L. C., & Foorman, B. R. (2003). Measuring teachers' content knowledge of language and reading. Annals of Dyslexia, 53(1), 23-45.
Hudson, A. K., Moore, K. A., Han, B., Wee Koh, P., Binks-Cantrell, E., & Malatesha Joshi, R. (2021). Elementary teachers' knowledge of foundational literacy skills: A critical piece of the puzzle in the science of reading. Reading Research Quarterly, 56, S287-S315.
Piasta, S. B., Connor, C. M., Fishman, B. J., & Morrison, F. J. (2009). Teachers' knowledge of literacy concepts, classroom practices, and student reading growth. Scientific Studies of Reading, 13(3), 224-248.
Piasta et al. (2009) reached these conclusions about the causes of weaker student growth based on observations of teachers with low levels of reading knowledge.
McCutchen, D., Green, L., Abbott, R. D., & Sanders, E. A. (2009). Further evidence for teacher knowledge: Supporting struggling readers in grades three through five. Reading and Writing, 22(4), 401-423. Retrieved from https://www.researchgate.net/profile/Laura-Green-30/publication/225420616_Further_evidence_for_teacher_knowledge_Supporting_struggling_readers_in_grades_three_through_five/links/00b7d521babc49242a000000/Further-evidence-for-teacher-knowledge-Supporting-struggling-readers-in-grades-three-through-five.pdf