Overview

There is strong correlation between the academic aptitude of a teacher and student achievement.

While academic aptitude is not the only quality of a successful teacher, it is a critical factor. Sixty years of research and evidence from nations whose students outperform our own have demonstrated that teachers who were themselves good students are more likely to advance student learning. Because there is no single indicator of academic aptitude which is failsafe (as with any measure of teacher attributes), a number of different approaches are possible, involving a mix of measures including test score data from the SAT, ACT, or GRE and performance measures such as a teaching audition and a candidate's academic record (GPA)—which serve not only as an indicator of aptitude but effort as well.

Info icon
See the full details on how we scored the Admissions standard.
Review our Methodology
Findings

Two-thirds of undergraduate teacher preparation programs draw most or all of their teacher candidates from the top-half of the college-going population.

Who is getting into undergraduate teacher preparation?
chart

n=894. Figures may not add to 100% due to rounding. For precise definitions of how undergraduate programs are scored under the Admissions standard, see the methodology here.

Because many of the institutions that house teacher preparation programs are highly selective in their undergraduate admissions, their median SAT or ACT scores largely define the pool of prospective candidates available to these programs. While teacher preparation programs (like many majors) have their own admissions criteria and can choose to impose higher academic standards than their institutions' admissions standards, few do. Of the nearly 900 undergraduate elementary programs in this present analysis, just 12 independently set thresholds on standardized measures that limit admissions to students from the top-half of the college-going population.

Half of graduate and non-traditional programs do not adequately screen applicants for academic aptitude.

%

of graduate and non-traditional programs earn an F on this standard as their admissions do not include an acceptable measure of academic aptitude.

Graduate and non-traditional programs that set a minimum admissions GPA of 3.0 (or by providing evidence of an average cohort GPA of 3.3) AND require either the GRE/MAT or an audition as part of the application process qualify for an A under the Admissions standard (15% of programs). Programs that require just one acceptable measure of academic aptitude, meaning, for example, that they might not have any GPA requirement but they do require an audition, earn a C under the Admissions standard (36% of programs). Additional details can be found in the graduate scoring rubric.

Applicants generally apply to graduate and non-traditional programs directly, with each program setting its admissions standards independent of the institution, which leaves the program's admissions criteria as the sole barrier to entry. Nearly half (48%) of these programs fail to employ at least one adequate screen of academic aptitude, essentially an open admissions process.

The clear majority of teacher preparation programs (75%) do not require applicants to hold a B average (3.0 GPA). In fact, 12% of programs do not consider applicants' academic records.
Minimum GPA requirements for admission into all elementary teacher preparation programs
chart

n=1,257. Figures may not add to 100% due to rounding.

Programs that formally admit candidates as freshman and rely on a high school-based GPA admissions requirement (19 programs) are not represented.

Insights

1

There has been little movement by programs to become more selective since NCTQ's last release in 2016.

A comparison of the 2021 results with those of previous editions of the Teacher Prep Review would appear to indicate that undergraduate programs are becoming more selective with 8% more As and Bs and an equal percentage fewer Ds and Fs. However, the shift is most attributable to an expanded program sample, improved access to institutional data, and more programs submitting data on the average GPA for a cohort (one of the ways that programs can satisfy this standard).1 There is scant evidence to suggest this shift is the result of programs becoming more selective. For example, the median institutional SAT score of programs in the sample actually decreased by 6 points, while the average program admissions GPA only narrowly improved from 2.72 to 2.75.

2

While a number of institutions have discarded the SAT and ACT, they have replaced them with reliable measures of academic aptitude. Teacher preparation programs discarded the SAT and ACT but never replaced them with any proxy.

As many of the institutions have discarded the SAT and ACT, they announced their intention to give greater weight to GPA or even develop their own assessments.2 Teacher preparation programs have abandoned these reliable proxies and have also opted against raising their generally low GPA standards. In this present analysis, only 31 undergraduate programs (3% of all undergraduate programs reviewed) set SAT or ACT thresholds for admissions without providing a way to bypass these requirements,3 and of those programs, just 12 set those thresholds at the level required to limit admissions to candidates who come from the top-half of the college-going population.

3

Unlike a number of other majors, teacher preparation programs defer to the admissions standards of the institutions in which they are housed.

Undergraduate teacher preparation programs rarely exercise a more exclusive admissions policy than the institution. These low admissions standards are laid bare with graduate and non-traditional programs, where half (49%), in the absence of institutional admissions standards, do not independently set acceptable measures of academic aptitude.

How We Scored

Evaluation of undergraduate programs relies on four sets of data:

  • Mean university SAT/ACT scores sourced from the Integrated Postsecondary Education Data System (IPEDS)4

  • Barron's selectivity ratings (in the absence of data on SAT/ACT scores) sourced from Barron's Profiles of American Colleges5

  • Minimum GPA and admissions test requirements sourced from the undergraduate catalog or admissions requirements webpage6

  • Mean GPA for the most recently admitted cohort of teacher candidates provided by the program7

Evaluation of graduate and non-traditional programs relies on two sets of data:

  • Minimum GPA, admissions test, and audition requirements sourced from the graduate catalog or admissions requirements webpage8

  • Mean GPA for the most recently admitted cohort of teacher candidates provided by the program9

Institutional characteristics -- median SAT and ACT scores and Barron's ratings -- are collected for each institution, where available. Separately, a team of analysts use course catalogs and program admissions webpages to determine the admissions requirements specific to the teacher preparation program.

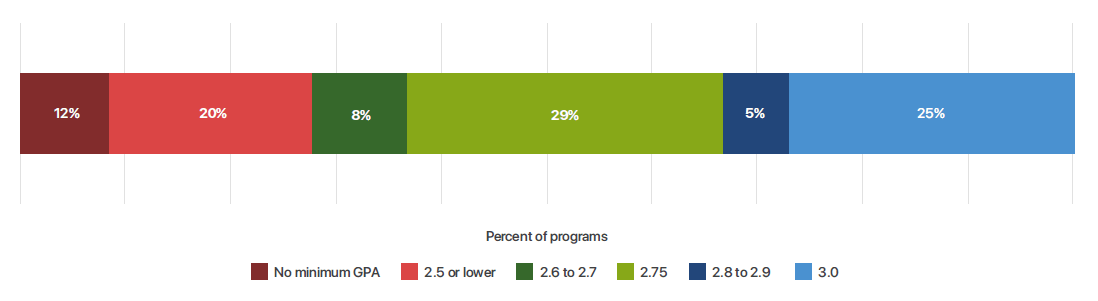
For undergraduate programs, which typically admit teacher candidates in their junior year, we identify the minimally acceptable GPA to enter the program. Acceptable thresholds for graduate and non-traditional programs can be either a candidate's overall GPA or that of upper division coursework only. In instances where a program sets both unconditional and conditional GPA thresholds, separate measures for different segments of undergraduate coursework, or other variations where there are multiple minimums, we use the value that applies to all coursework and serves as the floor for all admitted candidates.

  • Example of conditional admission: Candidates must submit "official transcript(s) indicating a minimum grade point average (GPA) of 3.0 on a 4.0 scale of all undergraduate and post-baccalaureate coursework combined," but then allows conditional admission on the under the criteria that "Applicants who do not meet the minimum GPA requirement of 3.0 will be required to successfully complete a full 500-600-word writing sample." Since a 3.0 GPA is not a true floor for admissions, the program would not receive credit for the unconditional requirement.

  • Example of segmented requirements: Candidates must have either "a cumulative grade point average (GPA) of 2.75 or a GPA of 3.0 over the two most recent semesters." We would use the 2.75 figure in this case since it reflects the more universal requirement.

  • Example of multiple minimums: Candidates must submit a transcript demonstrating "a cumulative undergraduate GPA of 3.0 or a GPA of 2.8 for all upper division coursework." This program would be noted as requiring a 2.8 GPA since it is the lower baseline under which candidates can be admitted.

Both undergraduate and graduate programs are invited to share the certified GPA of their most recent cohort of admitted students. When provided, these figures are considered on a separate, more demanding scale from the minimum GPA values because, while this mean value is a representation of the strength of the admitted candidates, it does not ensure that all candidates possess a GPA above the program minimum.

In addition to collecting GPA requirements for undergraduate programs, analysts also identify any SAT or ACT admissions requirements set by the program. For graduate and non-traditional programs, we catalog any graduate-level admissions test requirements (GRE, MAT) and the details of any audition process. These standardized tests that are normed to the entire college-going population are only considered to be requirements in cases where candidates cannot bypass a passing score with an alternative measure (GPA, basic skills test, personal statement, etc.)

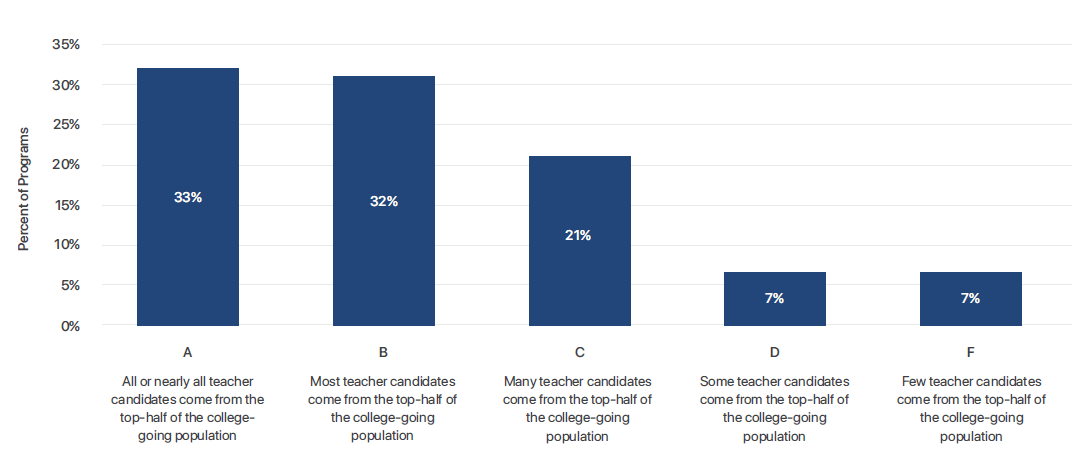
Once these data are collected, as detailed under the Scoring Rubric, undergraduate program grades are determined by the highest achieved criteria, while graduate and non-traditional program grades are derived from the sum of the GPA and candidate screening measures.

Undergraduate programs are evaluated separately on their institutional characteristics and program admissions requirements. The final grade for each program is the higher of the two resulting grades.

Undergraduate programs
Grade Teacher Prep Admissions Requirements Institutional Characteristics

A

The program sets a minimum admissions requirement on standardized measures that ensures all teacher candidates come from the top half of the college-going population.

Minimum SAT score >/= 1006

or

Minimum ACT score >/= 21

The median student comes from 70th percentile or higher on standardized measures, suggesting that all or nearly all teacher candidates come from the top-half of the college-going population.

Institutional median SAT score >/= 1120

or

Institutional median ACT score >/= 24

or

When neither SAT or ACT reported, Barron's rating of "Most Competitive"

B

The program sets a minimum admissions requirement on standardized measures that ensures all teacher candidates come from the top 60 percent of the college-going population. Alternatively, the program sets a selective minimum GPA or can demonstrate through the GPA of the most recently admitted cohort that most candidates come from the top-half of the college-going population.

Minimum SAT score >/= 980

or

Minimum ACT score >/= 20

or

Minimum GPA >/= 3.3

or

Cohort GPA >/= 3.5

The median student comes from 60th percentile or higher on standardized measures, suggesting that most teacher candidates come from the top-half of the college-going population.

Institutional median SAT score >/= 1060

or

Institutional median ACT score >/= 22

or

When neither SAT or ACT reported, Barron's rating of "Highly Competitive"

C

The program sets a competitive minimum GPA or can demonstrate through the GPA of the most recently admitted cohort that many candidates come from the top-half of the college-going population.

Minimum GPA >/= 3.0

or

Cohort GPA >/= 3.3

The median student comes from 50th percentile or higher on standardized measures, suggesting that many teacher candidates come from the top-half of the college-going population.

Institutional median SAT score >/= 1006

or

Institutional median ACT score >/= 21

or

When neither SAT or ACT reported, Barron's rating of "Very Competitive"

D

The program sets a minimum GPA that suggests some candidates come from top-half of the college-going population.

Minimum GPA >/= 2.75

When neither SAT or ACT reported, Barron's rating of "Competitive"

F

Does not meet any of the above criteria

Graduate and non-traditional programs
Measure Criteria Points

GPA

Program requires a minimum admissions GPA of 3.0

or

Most recently admitted cohort has an average GPA of at least 3.3

If yes for either: 2 points

If no for both: 0 points

Candidate Screening

Program requires either the submission of a typical graduate admissions test (like the GRE)

or

Program requires a rigorous audition that assesses the applicant's (1) classroom presence, (2) problem-solving and interpersonal skills, and (3) capacity to persevere in the pursuit of improved student outcomes.

If yes for either: 2 points

If no for both: 0 points

A grade = 4 points / C grade = 2 points / F grade = 0 points

Strong research indicates that higher teacher selectivity, as measured by factors such as SAT scores and, to lesser degrees, average GPA prior to program admission and an institution of higher education's (IHE) general competitiveness is correlated with increased student achievement.10

Additional research spanning six decades11 supports higher academic admissions standards for entry into teacher training programs, including studies showing: 1) a relationship between teacher "verbal ability" (frequently measured by SAT, ACT, or other vocabulary tests) and student achievement;12 and 2) a similarly strong correlation between the selectivity of the teacher's college and student achievement.13 Education programs often use licensing tests (e.g., Praxis I) as admissions criteria for teachers, so the tests provide another useful measure of both teachers' expected teaching ability and education programs' selectivity.14 Furthermore, a recent but limited study in Mississippi found that middle school students whose teachers earned higher ACT scores had higher levels of proficiency in math, reading, and writing on the state test.15 Moreover, a recent study found that ELA teachers who attended more competitive IHEs produced longer-lasting learning benefits (as measured by the persistence of teachers' value-added effects on students) than teachers from less competitive IHEs.16

In countries whose students outperform our own, studies show a clear pattern wherein teacher preparation programs recruit and admit the most academically capable young adults into the profession. McKinsey's 2007 study of high-performing educational systems indicates that other countries set a high bar, with the least selective among their high-performing institutions still selecting teacher candidates from only the top third of students.17 By contrast, as the Teacher Prep Review shows, most U.S. teacher preparation programs are not ensuring that candidates are drawn from the top half of the college-going population. Given the decline in academic performance and diversity of aspiring teachers, as documented by ACT's annual report, "The Condition of Future Educators," prep programs must make a deliberate effort to attract and prepare the best candidates.18 This standard also receives support from school district superintendents and members of the Association of American Educators (AAE).19

Endnotes
  1. Programs are added and removed from each edition of the Teacher Prep Review for a variety of reasons, but often additions are the result of increased teacher production, while removals simply reflect program closures. The institutions for which the 46 undergraduate elementary programs that were removed following the previous edition carried an average SAT score of 1043 (with a 21.9 on the ACT), while the 59 programs that were added reside in institutions that averaged 1068 (23.5). In short, the sample shifted towards more selective institutions.

    The availability of institution-level SAT and ACT data served as another factor. Nearly half of the 60 elementary programs that did not have median SAT scores in the 2016 IPEDS database reported figures this time. An even bigger gap was closed with ACT data, where 34 of 52 programs that didn't previously report scores provided that information. In about a dozen of these cases, the specific SAT or ACT score replaced our use of Barron's selectivity rating and resulted in the grades for those programs improving to an A or B.

    Finally, for this edition of the Teacher Prep Review, 136 elementary programs submitted data on the average GPA of their most recent cohort of admitted students, which is a considerable increase over the 39 programs that provided data in 2016. What's more, over a third of the most recent submissions identified cohort GPAs of 3.5 or higher, enough to earn those programs B under the standard.

  2. Camera, L. (2020, May 21). University of California System to Drop SAT, ACT Requirement. US News. Retrieved from https://www.usnews.com/news/education-news/articles/2020-05-21/university-of-california-system-to-drop-sat-act-requirement

  3. In most instances where programs set SAT or ACT score thresholds for admissions, they allow for the substitutions of other measures as alternatives, which can include grade point averages, essays, or most commonly, a basic skills test like the Praxis CORE. Because basic skills tests are normed only to those intending to become teachers, and not the college-going population as a whole, the results, and any threshold set by the program, are not considered a reliable measure of academic aptitude. The 31 programs noted above are those that do not allow for any substitutions for SAT or ACT scores.

  4. Based on a three-year average of SAT/ACT scores for years 2015-2016 through 2017-2018. Accessible at: https://nces.ed.gov/ipeds/use-the-data

  5. Sourced from: Barron's Educational Series. (2018). Profiles of American Colleges 2019.

  6. This information was collected using the most up-to-date catalog and website information that was available between September and November 2019. The most frequently cited catalog edition was 2019-2020.

  7. For consideration, submitted data had to reference either the 2018-2019 or 2019-2020 academic years.

  8. This information was collected using the most recent catalog and website information that was available between October and November 2019. The most frequently cited catalog year was 2019-2020.

  9. For consideration, submitted data had to reference either the 2018-2019 or 2019-2020 academic years.

  10. For research supporting greater selectivity for teacher preparation programs, see Boyd, D., Lankford, H., Loeb, S., Rockoff, J., & Wyckoff, J. (2008). The narrowing gap in New York City teacher qualifications and its implications for student achievement in high-poverty schools. Journal of Policy Analysis and Management, 27(4), 793-818. Steele, J. L., Pepper, M. J., Springer, M., & Lockwood, J. R. (2015). The distribution and mobility of effective teachers: Evidence from a large, urban school district. Economics of Education Review, 48, 86-101. Lincove, J. A., Osborne, C., Mills, N., & Bellows, L. (2015). Teacher preparation for profit or prestige: Analysis of a diverse market for teacher preparation. Journal of Teacher Education, 66(5), 415-434. Henry, G. T. Bastian, K. C. & Smith, A. A. (2012). Scholarships to recruit the "Best and Brightest" into teaching: Who is recruited, where do they teach, how effective are they, and how long do they stay? Educational Researcher, 41(3), 83-92.

  11. Clotfelter, C. T., Ladd, H. F., & Vigdor, J. L. (2007). How and why do teacher credentials matter for student achievement? (Working Paper No. 12828). Cambridge, MA: National Bureau of Economic Research. Clotfelter, Ladd, and Vigdor found college selectivity to have a positive impact on student achievement in North Carolina. For more research supporting greater selectivity for teacher preparation programs, see Gitomer, D. (2007). Teacher quality in a changing policy landscape: Improvements in the teacher pool. Princeton, NJ: Educational Testing Service; Retrieved February 6, 2013, from http://www.ets.org/Media/Education_Topics/pdf/T; Goldhaber, D., Perry, D., & Anthony, E., (2004). NBPTS certification: Who applies and what factors are associated with success? Seattle, WA: Center for Reinventing Public Education; Whitehurst, G. J. (2002). Scientifically based research on teacher quality: Research on teacher preparation and professional development. (Paper presented at the 2002 White House Conference on Preparing Tomorrow's Teachers); Kain, J., & Singleton, K. (1996, May-June). Equality of education revisited. New England Economic Review, (May), 87- 114.; Ferguson, R., & Ladd, H. (1996). How and why money matters: An analysis of Alabama schools. In H. Ladd (Ed.), Holding schools accountable. Washington, DC: Brookings Institution; Greenwald, R., et al. (1996). The effect of school resources on student achievement. Review of Educational Research, 66(3), 361-396; Ferguson, R. (1991). Paying for public education: New evidence on how and why money matters. Harvard Journal on Legislation, 28, 465-498; Strauss, R., & Sawyer, E. (1986). Some new evidence on teacher and student competencies. Economics of Education Review, 5(1), 41-48; McLaughlin, M., & Marsh, D. (1978). Staff development and school change. Teachers College Record, 80(1), 69-94; Summers, A., & Wolfe, B. (1977). Do schools make a difference? American Economic Review, 67(4), 639-652; Hanushek, E. (1971). Teacher characteristics and gains in student achievement: Estimation using micro-data. American Economic Review, 61(2), 280-288. Master, B., Loeb, S., & Wyckoff, J. (2014). Learning that lasts: Unpacking variation in teachers' effects on students' long-term knowledge (working paper). Washington, D.C.: National Center for Analysis of Longitudinal Data in Education Research.

  12. Numerous research studies have established the strong relationship between teachers' vocabulary (a proxy for being broadly educated) and student achievement. For example, see Whitehurst, G. J. (2002); Ehrenberg, R., & Brewer, D. (1995). Did teachers' verbal ability and race matter in the 1960s? Coleman Revisited. Economics of Education Review, 14, 1-21; Levin, H. M. (1970). A cost-effectiveness analysis of teacher selection. Journal of Human Resources, 5(1), 24-33. Aloe and Becker (2009), however, found that the evidence on teacher verbal ability is dated. Aloe, A. M., & Becker, B. J. (2009). Teacher verbal ability and school outcomes: Where is the evidence? Educational Researcher, 38(8), 612-624.

  13. Ehrenberg, R., & Brewer, D. (1994). Do school and teacher characteristics matter? Evidence from high school and beyond. Economics of Education Review, 13(1), 1-17; Wayne, A., & Youngs, P. (2003). Teacher characteristics and student achievement gains: A review. Review of Educational Research, 71(1), 89-122; Winkler, D. (1975). Educational achievement and school peer composition. Journal of Human Resources, 10, 189-204.

  14. Clotfelter, C., Ladd, H., & Vigdor, J. (2007). A study of elementary teachers in North Carolina also found that teachers with test scores one standard deviation above the mean on the Elementary Education Test as well as a test of content were associated with increased student achievement of 0.011 to 0.015 standard deviations.

  15. Mississippi Life Tracks. (2013). Teacher quality & student performance: A report on the impact of teachers' ACT scores on student proficiency on standardized tests. Retrieved from https://lifetracks.ms.gov/RequestAnalysis/ResearchStudies.aspx. Note: This study does not use randomized assignment of students to teachers, nor does it control for students' prior proficiency levels or use any other measures of student growth while in a teacher's class. Consequently, while these data may indicate that there is a causal relationship between teachers' ACT scores and student proficiency, an equally plausible explanation is that students with higher levels of proficiency are assigned to teachers with higher ACT scores.

  16. Master, B., Loeb, S., & Wyckoff, J. (2014).

  17. Barber, M., & Mourshed, M. (2007). How the world's best-performing school systems come out on top. McKinsey & Co., 16. For a discussion of teacher preparation program admissions policies in other countries, see McKenzie, P., Santiago, P., Sliwka, P., & Hiroyuki, H. (2005). Teachers matter: Attracting, developing and retaining effective teachers. Organisation for Economic Co-operation and Development. Similarly, a comparison across 23 countries found that teachers' cognitive skills were "an important determinant of international differences in student performance." Hanushek, E. A., Piopiunik, M., & Wiederhold, S. (2014). The value of smarter teachers: International evidence on teacher cognitive skills and student performance (No. w20727). National Bureau of Economic Research.

  18. ACT. (2015). The Condition of Future Educators 2015. Retrieved from http://www.act.org/content/dam/act/unsecured/documents/Future-Educators-2015.pdf

  19. In 2016, 77% of respondents to the AAE membership survey "agreed with a recent NCTQ report that ranks schools of education and recommends requiring rigorous teacher prep program admission tests, an admission GPA of 3.0 or higher, and the passage of subject-matter tests as a condition of admission into teacher programs." Association of American Educators. (2016). AAE national membership survey: Professional educators embrace solutions. Retrieved from http://www.aaeteachers.org/images/pdfs/2016.survey.pdf.

Symbol

Get More Updates On Our Research