
The number of college students preparing to become teachers is viewed as an indicator not only of the future supply of teachers in the nation, but also of the desirability of the teaching profession1. Data on enrollment into Teacher Preparation Programs (TPPs) collected via the Title II federal mandate by the U.S. Department of Education can provide insight into future teacher shortages or surpluses, the composition of the future teacher workforce, and the attractiveness of K-12 teaching as a profession.
For this brief, we processed Title II data (which covers enrollment, completion, and more) to make it more accessible to the public. Here, we present the trends for the last 10 reported years of how many people enrolled2 in and completed TPPs by state and type of route, paying particular attention to candidates of color. We provide data dashboards below that explore national trends and the variability in state teacher preparation program enrollment and completion.
Overall teacher preparation enrollment and completion trends
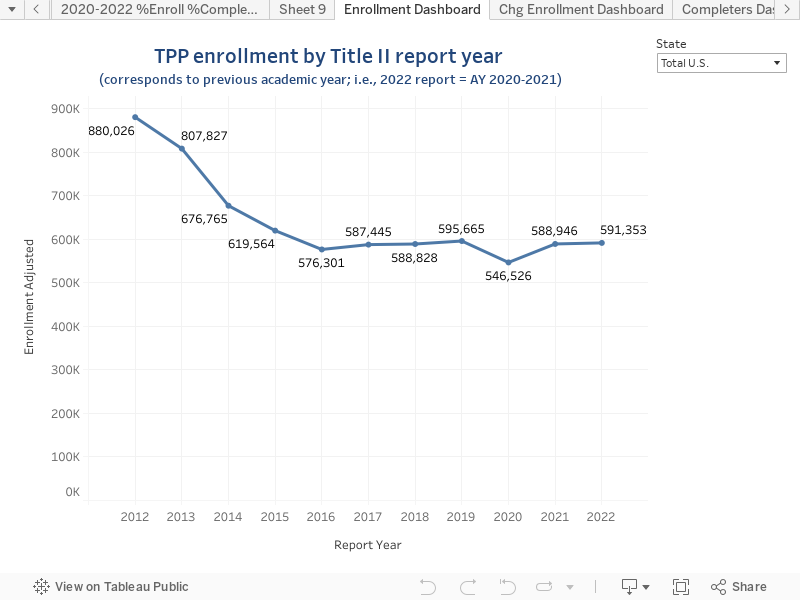
Enrollment3 in teacher preparation programs stands at 70% of what it was 10 years earlier, according to the latest Title II data. In the academic year 2020-21, 591,000 people were enrolled in TPPs in the 50 states plus DC, compared to 880,000 in the 2010-11 academic year.
Total enrollment in teacher preparation programs–including both traditional and alternative preparation programs–dropped steadily at the beginning of the last decade, and “hit bottom” in 2015. It has remained relatively stable since, with the exception of the 2018-2019 academic year, when it fell even further.
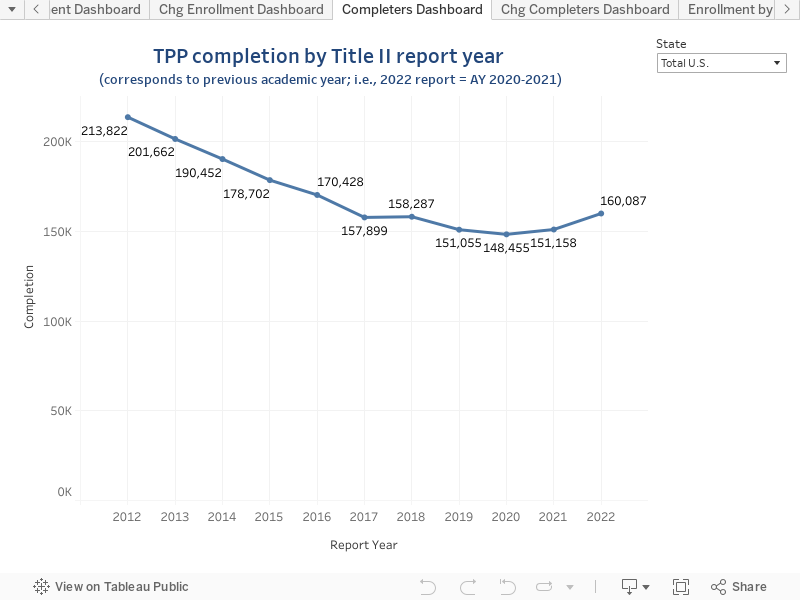
The total number of teacher preparation completers4 has also fallen steadily over the past decade, declining from nearly 214,000 in the academic year 2010-11 to 160,000 ten years later, a drop of more than 25%. TPP completion reached its lowest levels in 2018-19. Both total enrollment and total completion have each seen a meaningful 8% recovery in the academic year 2020-21 compared to pre-pandemic levels in 2018-19.
Important to note among these trends is that there is high variability in enrollment among states. In the last two years of the Title II data reporting, 39 states saw increases in teacher preparation program enrollment, 27 of which experienced increases
above the national average, while 12 saw a decrease in enrollment (Colorado, Connecticut, Massachusetts, Minnesota, Montana, Nevada, North Carolina, North Dakota, Oklahoma, South Dakota, Virginia, and Wyoming).
The changes in completion rates also show high variability among states. Teacher preparation program completion in 20 states decreased between the academic years 2018-19 and 2020-21 (the last academic year reported by Title II), while 31 states saw an increase, with 21 of them increasing above the national average.
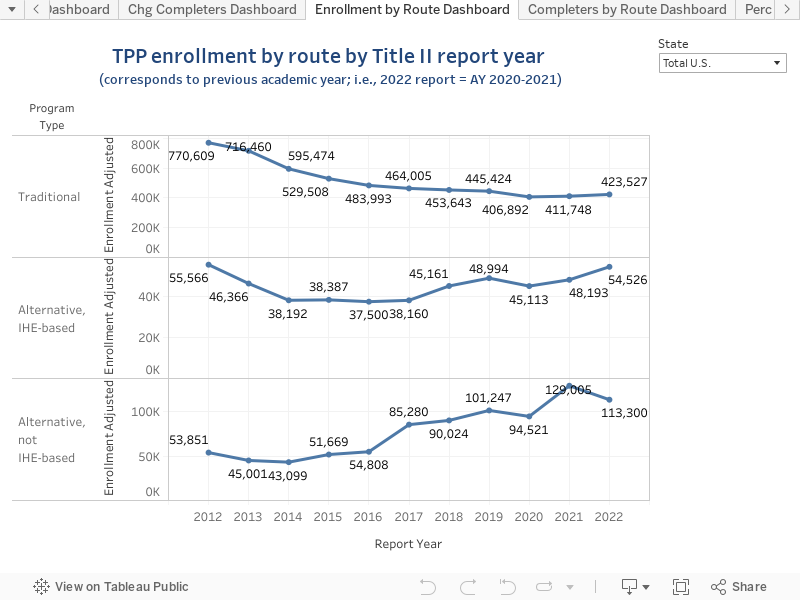
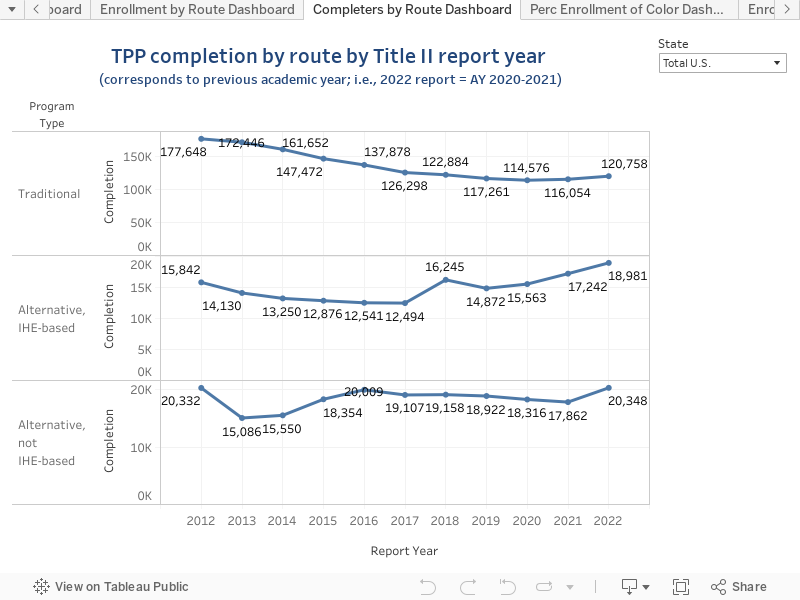
Traditional vs. alternative routes
Most of the recovery that we’re beginning to see in teacher preparation enrollment and completion is due to alternative route programs5. Enrollment and completion in alternative TPPs increased by 20% and 16% respectively between the 2018-19 and the 2020-21 academic years, whereas enrollment and completion in traditional TPPs increased by only 4% and 5% respectively in the same period.
Changes in total enrollment over the last two years range from a 30% decrease in North Dakota to an 88% increase in Mississippi. As examples of how traditional and alternative routes impact state production, North Dakota’s 30% decrease in enrollment in the two most recent years of Title II data is entirely due to lower enrollment into
traditional TPPs. Conversely, while enrollment in alternative TPPs tripled in Mississippi, the state experienced an overall 88% increase in teacher candidates.
Changes in teacher preparation program completion range from a 31% decrease in Massachusetts to an increase of 63% in Delaware. Similar patterns of influence of traditional versus alternative routes can be seen in completion rates as well. Massachusetts’ decrease is due mainly to lower numbers of completers in traditional programs, while Delaware’s increase primarily comes from alternative TPPs completers.
With a large movement of candidates towards more alternative preparation programs, it is imperative for state leaders and policymakers to recognize the need to make sure these programs are adequately preparing aspiring teachers. If not, the efforts to bolster enrollment and completion are unlikely to improve teacher quality and, in turn, will likely hurt retention efforts since more teachers will enter the profession under-prepared.
Candidates of color
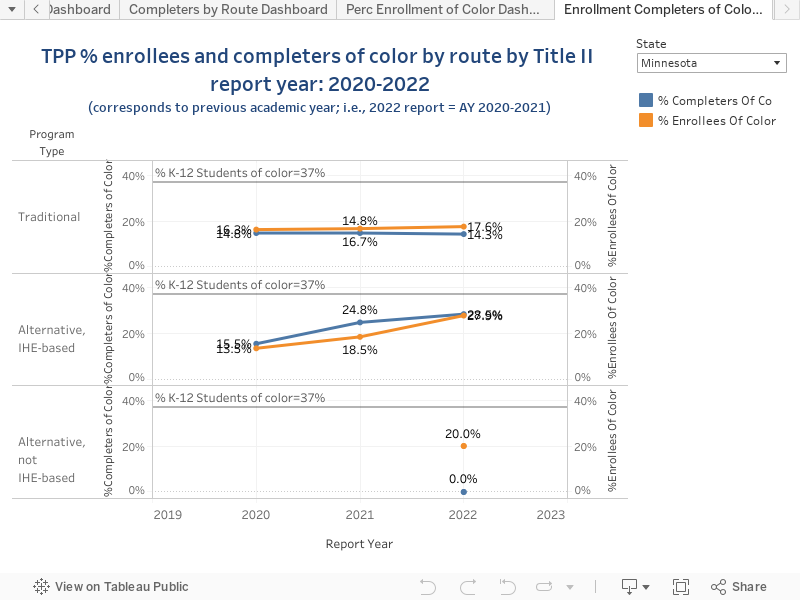
Enrollment and completion of candidates of color has increased in most states over the last two years reported by Title II. Thirty-eight states have seen an increase in candidates of color completing preparation programs between the academic years 2018-19 and 2020-21, while 13 states have experienced a decrease (Alabama, Colorado, Florida, Kansas, Louisiana, Massachusetts, Minnesota, New Hampshire, New Jersey, North Dakota, Oregon, Vermont, and Virginia).
Mississippi stands out for increasing the state’s production of teacher preparation completers of color both via traditional and alternative routes to the point that it has significantly changed the state’s composition of TPP enrollers and completers: Mississippi’s share of enrollees of color went from near 30% to around 60%, and its share of completers of color went from near 15% to 25% between the academic years of 2018-19 and 2020-21.
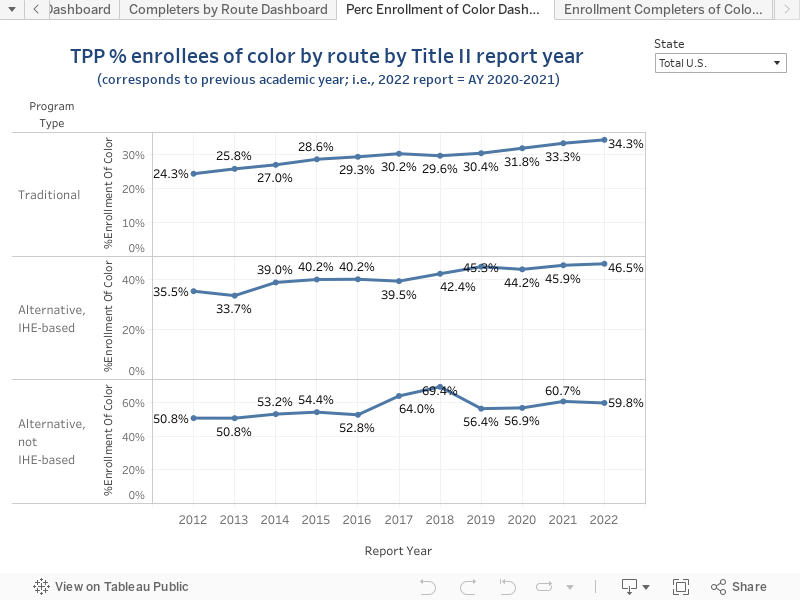
There’s also a wide variety in how well different types of teacher prep programs attract candidates of color. About a third of all enrollees in traditional teacher preparation programs are candidates of color. This share increases to over 40% in alternative teacher prep programs provided by Institutions of Higher Education (IHE), and to near 60% in alternative programs that operate independent of any college or university. Unfortunately, the latter also have the lowest retention rates of all three types of routes.
Explore the data
Browse the national data and data by state here6 to see how your state compares.
More data is needed for effective policymaking
For a more robust understanding of teacher shortage areas, these supply data can be coupled with vacancy data available at
teachershortages.com.
While both this supply data and the vacancy data available at
teachershortages.com provide important context for teacher shortage areas, state policymakers need more detailed supply and demand data (such as disaggregation by subject area, geographic area, school level) to enact effective policies that will help eliminate teacher staffing challenges. State-level data alone only tells part of the story. For example, policymakers may consider providing incentives or additional pay to attract teachers in high-need subject areas or schools, but without data to identify which areas have the greatest need (e.g., special education teachers, math teachers, teachers in rural areas, etc.), policymakers are left to devise broad policy solutions that often lack specificity to address acute staffing challenges.
Last year, NCTQ summarized what
supply and demand data states currently have available and created a Teacher Supply and Demand State Data Guide that helps states understand what data elements they need to collect in order to answer critical questions about the teacher workforce, such as: How many teachers is the state producing in each subject area? How does the production of teachers impact the ability to fill vacancies geographically? Are individuals who complete preparation programs in a state, staying in the state to teach or going elsewhere to find a job?
Better supply and demand data are critical for mitigating teacher vacancies and ensuring that every child has access to a well-prepared, effective teacher.

More like this

Pay increases and other non-obscure strategies to address the substitute teacher shortage
How several large school districts are revisiting policies surrounding pay and health benefits to attract prospective substitute teachers.

What school districts can do to tackle teacher shortages
Coverage of teacher shortages tells of real struggles faced by districts, but it only tells part of the story.
Endnotes
- Kraft, M. A., &
Lyon, M. A. (2022). The Rise and Fall of the Teaching Profession: Prestige,
Interest, Preparation, and Satisfaction over the Last Half Century.
EdWorkingPaper No. 22-679. Annenberg Institute for School Reform at Brown
University. - Note that in 2020, starting with its 2018-29 report, Title II changed the way it reports enrollment. Before 2020, according to their Glossary, enrollment numbers omitted that year’s completers; which means that a student who completed the program that year was not counted as enrolled anymore. From 2020 on, their definition of enrolled student does include those completing the program that year. The trends presented in this brief account for the change in methodology, and the necessary adjustments (adding completers back to the pre-2020 data) have been made to make the data on enrollment comparable across the years.
- Enrollment is defined by Title II as “(a)n individual who has been admitted, enrolled, and registered in a teacher preparation program and participated in the program during the academic year.” For more information, please see Title II’s Glossary of Terms.
- Completer is defined by Title II as “(a) person who has met all the requirements of a state-approved teacher preparation program.” For more information, please see Title II’s Glossary of Terms.
- Alternative teacher
preparation programs are teacher education programs offered by educational
institutions often in partnership with local school districts, with the purpose
of preparing teachers for rapid entry into teaching. These programs can be
either based in an institution of higher education (IHE) or not. - Note that these
dashboards have been created with data provided on the Title II website and
have not been cross-checked with state or institutional data. In that sense,
the accuracy of information that they provide corresponds to the accuracy of
the information reported by Title II, which in turn depends on what the states
and their institutions have reported. Notably, enrollment of candidates of
color in alternative TPPs in the earlier years of this analysis appears
underreported, as many institutions did not offer a breakdown of their
enrollment by race, and all enrollees were reported as “White.” In addition,
Title II only started providing a breakdown of completers by race in their 2020
report.