According to a Center on Education and the Workforce report, the average lifetime earnings for a professional with a bachelor’s degree is $2.4 million, which increases to $2.8 million for those with a graduate degree.1 In both cases, that is about three quarters of a million (or around 40%) higher than the average lifetime earnings of teachers with bachelor’s or master’s degrees. Like all averages, the relative size of a teacher’s paycheck compared to other professionals’ paychecks will vary from district to district because the cost of living is not homogeneous throughout the country. Therefore, aside from how a particular district’s salary compares to that of other districts across the country, an important factor in salary satisfaction is how those salaries compare to other similarly educated professionals in the same locality.
The Census Bureau and the National Center for Education Statistics created the Comparable Wage Index for Teachers (CWIFT), which is a “measure of the systematic, regional variations in the wages and salaries of college graduates who are not PK-12 educators as determined by reported occupational category.”2 In other words, the CWIFT provides a reference for the cost of professional labor outside the teaching profession in specific school districts, adjusted for cost of living.
To contrast district-specific variations of teachers’ earnings with variations of the earnings in other professions, we constructed an index, adjusted for regional cost-of-living differences, for the average salaries of a representative teacher in the districts in our sample and compared it to the cost of labor outside the teaching profession provided by the CWIFT. (Refer to the methodological appendix for details on the construction of our teachers’ salary index and its comparison to the CWIFT). Such a comparison gives us an idea of the gap (cents on the dollar) that exists between teachers and other professionals in each school district, which doesn’t account for the fact that the average salary for teachers nationwide is also lower than the average salary for other professionals in the national labor market, which means that this gap calculation might still be underestimated.3
In the graph below, a 1.0 on the x-axis indicates that teachers and other professionals in the same locality earn similar salaries.
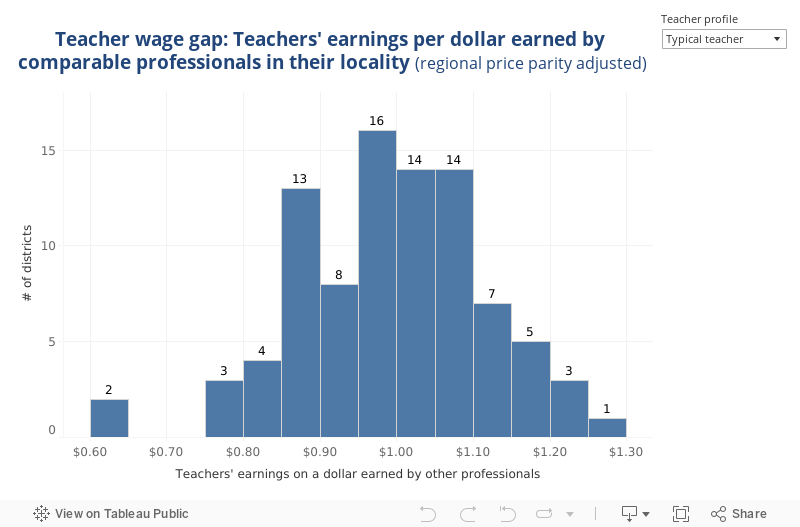
- The average annual teacher salary in more than half of the 90 districts analyzed in this study was lower than that of comparable professionals in their locality, adjusted for cost of living.
In the graph below, select the state and teacher profile of your choice to compare the teacher earnings’ gap across the corresponding districts.
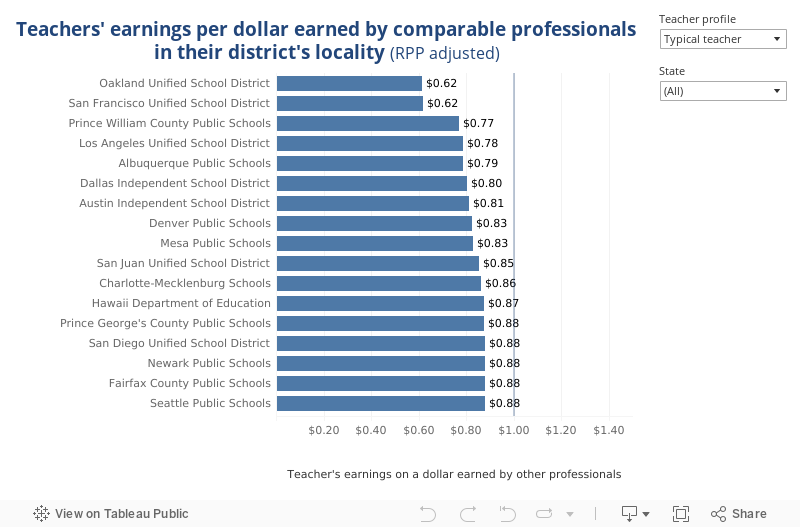
- For a typical representative teacher, the earnings gap can range from 39 cents less per dollar earned by comparable professionals outside the K-12 industry in the San Francisco area, to 27 cents more per dollar earned by comparable professionals outside the K-12 industry in Columbus, OH.
- Chicago Public Schools and Boston Public Schools, the districts that stand in the top two positions of the lifetime earnings ranking, move to the 7th and 20th position of the earnings gap ranking once relative salaries are taken into account. Both districts still offer their teachers higher relative pay than comparable professionals in other industries (19 and 8 cents per dollar more, respectively).
- Of note, Sioux Falls School District, which stands at the bottom of the lifetime earnings ranking in our sample, rises to the 16th position of the earnings gap ranking, as it offers its teachers approximately 10 cents more per dollar earned by comparable professionals outside the K-12 teaching industry. This is likely to have a positive effect on teacher salary satisfaction and possibly on teacher retention in their district.
Endnotes
- Carnevale, A. P., Cheah, B., & Hanson, A. R. (2015). The economic value of college majors. Washington, D.C.: Georgetown University Center on Education and the Workforce.
- Taylor, L. L., & Fowler Jr., W. J. (2006). A Comparable Wage Approach to Geographic Cost Adjustment. Research and Development Report. NCES-2006-321. National Center for Education Statistics.
- The national average predicted wage for professionals outside the K-12 teaching profession was $62,655 for the 2015 CWIFT, which adjusted for the national wages and salaries cost index amounts to $67,694 for the beginning of the 2018-2019 school year. The average wages for the representative teacher in the sample of our study is approximately $65,000. This could mean a 0.04-point underestimation in our gap calculation.