METHODOLOGY
In 2018 NCTQ completed the collection of attendance data for 30 of the largest school districts in the nation, which included in all cases detailed information on teacher absences for the 2016-2017 school year, and in some cases detailed information on the absences of the central office staff of the district. In a few cases we also received 2015-2016 attendance data. All the data used anonymous unique identifiers for teachers and central office staff.
The specific information provided by each district included:
1. A teacher roster with:
b. Tenure status where applicable
c. Years of experience
d. School name
e. Percentage of the student body in each school that receives free and reduced lunch (as a proxy for economically disadvantaged populations)
f. Total school enrollment
2. An absence database with:
b. In some cases the length of that absence
c. The reason for the teacher’s absence
3. A central office roster with:
b. Contract length
4. A central office absence database with:
b. In some cases the length of the absence
c. The reason for the staff absence
Between 2019 and early 2020, a team of analysts cleaned and processed the data. The following clean up procedures and classifications were implemented:
- Teachers in private or charter schools were removed from analysis. Only the absences of teachers corresponding to the roster of traditional public schools were analyzed. If a teacher was in the roster of more than one school, a “base school” was assigned to that teacher, which when possible corresponded to the school in which most of her absences took place.
- Only short-term absences were considered in the analysis. Absences lasting more than 10 consecutive days were eliminated (15 days in the case of central office staff1), so that absences caused by prolonged illnesses or parental leave would not be counted against the teacher’s attendance track. Absences for reasons such as “field trip” or “inclement weather” were also removed, as those are not considered to fall within a teacher’s decision power.
- Years of experience were grouped as: first year, 2 to 5, 6 to 10, 11 to 19, and more than 20.
- Absences were categorized as: sick, personal (e.g., vacation, family illness or bereavement), professional (e.g., professional development or other “school business”), and other (e.g., jury duty or military leave).
- Teachers were categorized according to their attendance record as:
- Excellent attendance – up to 3 days absent in the school year
- Moderately absent – between 4 and 10 days absent in the school year
- Frequently absent – between 11 and 18 days absent in the school year
- Chronically absent – 18 days of absence or more during the school year.
- The attendance categories of central office staff on a 12 month contract include 11 extra days to account for vacation time and a longer contract year. They were categorized according to their attendance record as:
- Excellent attendance – up to 14 days absent in the school year
- Moderately absent – between 15 and 21 days absent in the school year
- Frequently absent – between 22 and 28 days absent in the school year
- Chronically absent – 29 days of absence or more during the school year
- Following each district’s definition, schools were typified as: pre-K, elementary, middle, combo middle (if it included middle school plus either elementary grades or high school grades), high, K-12, and other.
- Schools’ free and reduced price lunch percentages were divided in quintiles, and each school was also assigned its corresponding quintile as a proxy of the poverty level of its student body.
- Central office staff contracts were categorized as either 10-month or 12-month contracts. 11-month contracts were treated as full year contracts.
Districts
The districts included in this analysis are:
Albuquerque Public Schools (NM)+
Atlanta Public Schools (GA)+
Baltimore City Public School System (MD)+
Boston Public Schools (MA)
Charlotte-Mecklenburg Schools (NC)+
Cleveland Metropolitan School District (OH)*
Dallas Independent School District (TX)*+(1)
Denver Public Schools (CO)*
District of Columbia Public Schools (DC)*
Fresno Unified School District (CA)+
Hillsborough County Public Schools (FL)*
Jefferson County Public Schools (KY)+
Jefferson Parish Public School System (LA)+
Knox County Schools (TN)+
Minneapolis Public Schools (MN)+
New York City Department of Education (NY)
Newark Public Schools (NJ)
Oklahoma City Public Schools (OK)+
Omaha Public Schools (NE)
Orange County Public Schools (FL)+
School District of Philadelphia (PA)+
Phoenix Union HIgh School District (AZ)+
Providence Public School District (RI)+
Sacramento City Unified School District (CA)
San Francisco Unified School District (CA)
San Jose Unified School District (CA)+
Seattle Public Schools (WA)+
Tulsa Public Schools (OK)
Wake County School District (NC)
* Includes teacher absences for the 2015-2016 school year
+ Includes central office data for the 2016-2017 school year
(1) Includes central office data for the 2015-2016 school year
STUDY OF CORRELATIONS
In addition to the statistics, graphs, and tables generated in the main report, a study of correlations was conducted, to establish the relationship between the number of days absent of a given teacher and some of the teacher’s, district’s, and school’s characteristics.
The variables used for this study include some of the ones submitted by the districts with their attendance data, plus some public information collected independently (e.g., percentage of students of color, maximum leave granted, etc.). All variables except tenure and school type were used in logarithms.
Variable description
Days in contract year – days in teacher’s contract year according to contracts retrieved and analyzed by NCTQ. For central office staff, this variable was provided by the district.
District enrollment – number of students in the whole district, obtained from each district’s public demographic data.
Experience – in years, provided by district, encoded as follows for all analysis outside of the study of correlations:
2=2-5 years
3=6-10 years
4=11-20 years
5=more than 20
FRL quintile – percentage of the student population that receives free and reduced lunch, usually provided by district.2 Encoded into quintiles, a numeric variable ranging from 1 to 5, for all other analysis outside of the study of correlations.
Max sick leave – maximum number of days of sick leave a teacher can take in the district, obtained from NCTQ’s Teacher Contract Database, which searches public information on school board documents and collective bargaining agreements.
Max personal leave – maximum number of days of personal leave a teacher can take in the district, obtained from NCTQ’s Teacher Contract Database, which searches public information on school board documents and collective bargaining agreements.
Number of teachers – number of teachers in the district, obtained from districts’ public demographic data.
Percentage of students non-white – 100% minus the percentage of the district’s student body categorized as “white”, obtained from each district’s public demographic data.
Real starting salary – district’s starting salary, obtained from the corresponding year’s salary schedules, divided by the regional price parity3 of the district’s nearest metropolitan area, allowing a comparison across districts.
Real base salary-experience – salary corresponding to the teacher’s category of experience and the midpoint between a bachelor’s and a master’s degree, according to the year’s salary schedule, divided by the regional price parity.4
School enrollment – number of students in the teacher’s school (or base school, for the case of teachers who teach in more than one school), usually provided by the district but otherwise obtained from each district’s public demographic data.
School type – categorized as follows:
schooltype=2 if SchoolType==”elementary”
schooltype=3 if SchoolType==”middle”
schooltype=4 if SchoolType==”combo middle”
schooltype=5 if SchoolType==”high”
schooltype=6 if SchoolType==”k-12″
schooltype=7 if SchoolType==”other”
Student-teacher ratio – the rate between the variables District Enrollment and the Number of teachers.
Tenure5 provided by district, encoded as follows: tenure=1, no tenure=0.
Total leave – base total days of leave a teacher can take in the district, inclusive of sick leave, personal leave, and any other time granted, obtained from NCTQ’s Teacher Contract Database, which searches public information on school board documents and collective bargaining agreements. It doesn’t include any extra days teachers might gain for longevity, for example.
Three main regressions were conducted. 1) Thirteen teacher level univariate regressions and one teacher level multiple regression between the number of days absent and thirteen personal, school, and district characteristics. 2) A teacher level multiple fixed effects regression by district, which eliminates district-level variables, and it’s meant to account for the variation within districts. 3) A central office staff level multiple regression between the number of days absent and the few available personal and district characteristics.
The results of this regression analysis are presented next.
Teacher absences
Univariate regressions6
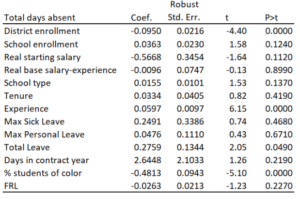
Multiple regression
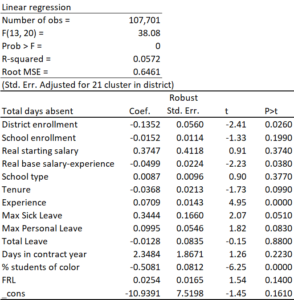
Fixed effects

Note: the logarithms of all variables except for School type and Tenure were included in the regression. All other variables are included in their original levels. Refer back to the Variable description section of this document for details on these variables.
Interpretation of coefficients
The variables that resulted most significantly related to teachers’ attendance were:
District Enrollment: This variable is significant and negative in the univariate and the multiple regression, while significant and positive in the fixed effects regression. A negative coefficient means that larger districts tend to have teachers that are absent fewer days. The particular coefficient means that if the number of students enrolled in a district is larger by 10%, all else constant, the average teacher absences over the school year are 1.3% smaller. Given that the average number of absences of the teachers in this study is just over 9 days, this means that a 10% larger student population in a district decreases teachers’ average absences by about an hour. A positive coefficient in the fixed effects regression indicates what happens when there is growth of enrollment within the district. A 10% enrollment increase in a given district appears to be accompanied by a 24% increase in teacher absenteeism.
Experience: This variable is also significant and has a positive coefficient in all three regressions. A positive coefficient means that teachers with more years of experience tend to be absent a larger number of days. The average experience for all teachers of this study is approximately 11 years. The coefficient in the multiple regression means that for every 10% increase in the years of experience of a teacher (or in the case of this study, for every extra year of experience ) a teacher is absent 0.7% more time on average, over the course of a school year. For example, teachers with 20 years of experience will be, on average, absent for a little over a day longer than a first year teacher.
Students of color: This variable is significant both in the univariate and the multiple regression (it is absent in the fixed effects regression because it’s a district level variable). A negative coefficient means that the higher the district’s percentage of students of color, the fewer days that their teachers are absent. This means that for every 10% increase in the student population of color, a teacher will be absent about 5% less (or in the case of this study, half a day less) over the course of the school year.
The following variables were significant in some, but not all, of the regressions:
FRL: This variable has a significant but small positive coefficient in the fixed effects regression, which captures the trends within each district rather than across districts. Across districts the relationship between FRL and number of absences is unclear. This means that within each district, in schools with higher levels of poverty, teachers tend to be absent more time. The average percentage of the student population eligible for free and reduced lunch in this study is about 70%. The coefficient then means that a teacher in a school with 50% of its student population eligible for free and reduced lunch is absent on average about 1% less than a teacher in the average school of this study with 70% FRL participation. Overall, what has been observed by graphing this data in relation to absenteeism, is that the relationship is not linear, and there is an increase in absenteeism with an increase in FRL participation up to the fourth quintile, and absenteeism decreases in the top quintile (highest percentage of economically disadvantaged students).
Max Sick leave (by district): A positive coefficient means that the more sick leave teachers have, the more total days of absence they have. This coefficient means that for every extra 10% of sick leave granted by the district (equivalent to a day, since the average sick leave granted by the districts in our study is about 10 days), a teacher on average is absent an extra 3.4% more or about 2.5 hours. This being the largest relationship between all types of leave indicates that teachers would use more sick leave than other types of leave if granted additional days.
Max Personal leave (by district): This coefficient is positive, which indicates that the more personal leave teachers have, the more total days of absence they have. For every 10% extra of personal leave granted by the district, teachers on average are absent 1% more over the course of the school year. This is equivalent to say that for every extra day of personal leave granted, a teacher on average uses about 2 more hours of leave over the course of the school year.
Real base salary in teacher’s experience bracket (adjusted for regional price parity): A negative coefficient means that the higher a teacher’s estimated salary (according to their experience), the lower their number of absences. The size of the coefficient in the multiple regression means that for every 10% increase in salary, all else constant, a teacher will on average be absent 0.5% less over the course of the school year.
School enrollment: This variable is only significant in the fixed effects regression. A negative coefficient means that within each district, larger schools tend to have teachers who are absent fewer days. The particular coefficient means that if the number of students enrolled in a school increases by 10%, all else constant, the average teacher absences over the school year will decrease by approximately 0.2%.
Tenure: This variable is only marginally significant in the multiple regression and it is likely that its effects are partially being picked up by a teacher’s experience.7 The coefficient of this variable is small and positive in both the univariate regressions and the fixed effects regression, and small and positive in the multiple regression.
Total leave (by district): A positive coefficient means that the more total leave teachers have, the more total days of absence they have. An extra 10% (or about a day and a half) of overall leave granted by the district increases a teacher’s absence by about 2 hours on average over the course of the school year.
The remainder of the variables were not significantly related to the number of teacher absences in this study in either of the regressions.
Central office absences
Multiple regression
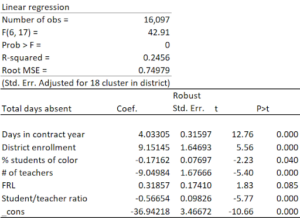
The limited data obtained with respect to the central office staff from districts limits our variable availability. The regression that was possible in this case contains the variables shown in the table above.
In the case of central office staff, it appears that the length of their contract year is positively correlated with their number of absences. The same can be said for the size of the district’s student population and the proportion of students eligible for free and reduced lunch: the larger the student body in a district, and the larger its percentage of FRL eligibility, the longer central office staff are absent.
Following the same pattern as teachers, we observe that a greater percentage of students of color is correlated with a smaller number of absences in the central office staff. The number of teachers that the central office staff serves, and the student/teacher ratio both appear related to a smaller number of absences.
Suggested Citation: Saenz-Armstrong, P. (2020). Roll Call 2020: Data and Methodology. National Council on Teacher Quality.
Endnotes
- Because district central office staff do not have vacation time built into their schedules and so are more likely to take extended vacations during the normal course of the year, the threshold for flagging central office staff absences for removal was set at a higher level.
- We recognize the potential bias introduced by the Community Eligibility Provision into this variable, but the bias has been deemed minor by the experts in the field and only potentially affecting less than 5% of our data, therefore we have decided to keep the variable as it was initially obtained for the regression analysis.
- Source: Bureau of Economic Analysis
- Orange County Public Schools does not have a salary structure that corresponds to years of experience. To estimate salaries, the tier ranges were evenly divided among the experience levels defined for this study.
- Only 21 districts provided information on tenure. Of the districts analyzed, Charlotte-Mecklenburg Schools, District of Columbia Public Schools, Hillsborough County Public Schools, Orange County Public Schools, and Wake County Public Schools do not currently grant tenure, although in some cases teachers’ tenure status may be grandfathered in.
- Although the results of the univariate regressions are all presented on one table, they correspond to each of the thirteen univariate models. They were also clustered for robustness of the standard errors.
- The Variance Inflation Factor (VIF) was calculated for the multiple variable models to test for multicollinearity, and the highest VIF found was less than 5, so no variables were removed on that account.