April 2013
Welcome to Tr3 Trends, NCTQ’s monthly newsletter designed just for
school district officials. Each month we use data from NCTQ’s Tr3 database to highlight the latest trends in school
district policies and collective bargaining agreements nationwide. Tr3 contains
teacher policies from 114 school districts, including the 50 largest districts,
the largest district in each state, Broad Prize winners, Gates investment
districts and members of the Council of the Great City Schools.
Without a doubt,
health insurance is the most important and expensive part of teachers’ benefits
packages, comprising a big chunk of districts’ compensation budgets. This month we delved into the Tr3 database to
compare districts’ contributions towards health insurance premiums. Here’s what we found:
Relative to most sectors, school districts
are a lot more generous about paying full freight. Almost 50% of districts for which we have health
benefits data pay up to 100% of health insurance premiums for individuals. The clear majority, 70%, pay up to 90% or
more of the premium.
Here’s a
district-by-district breakdown of the numbers:
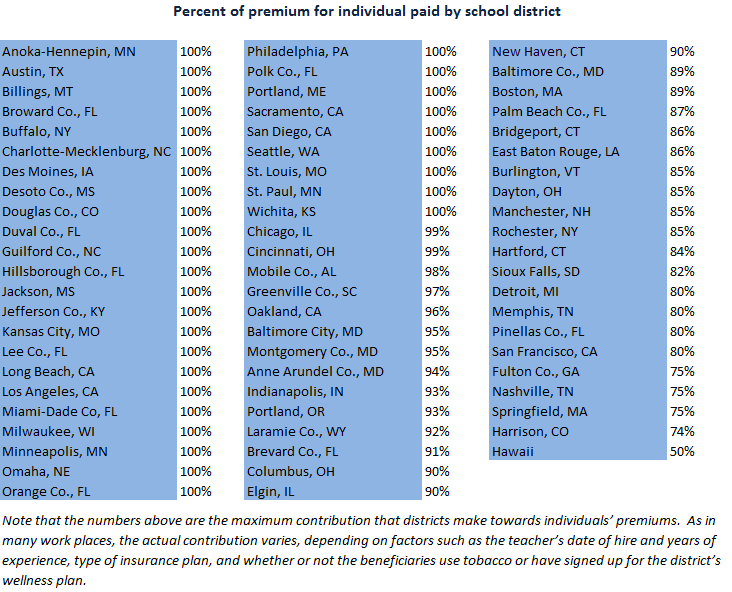
On average,
these 57 districts pay up to 93% of individuals’ premiums. By contrast, in 2012, the average employer
contribution across all industries was 82%, according to the Kaiser Family
Foundation’s Annual Health Survey.
Being a member of the union confers additional benefits on teachers in
some districts. For example, in Jefferson
Parish, Louisiana, where being a member of the union is not
obligatory, health insurance premiums are lower for union members. Union members in Columbus, Ohio, have additional
health insurance options beyond what the district provides all teachers.
Districts are not providing coverage for
dependents nearly as much as they used to.
Only one in five districts for which we have data (n=55) pay up to 100%
of health insurance premiums for dependents.
Three districts don’t contribute anything towards dependents’
premiums.
Here are the
numbers, district-by-district:

Together, these
districts’ average contribution to dependents’ premiums is 81%. That’s not much different than the average
across all industries in 2012, which was 72%, according to the Kaiser Family
Foundation’s Annual Health Survey.
Though we’ve
listed premium contributions as percentages, we’ve come across a number of
districts that put monetary caps on total health insurance contributions. In effect, that means districts can be
assured that they will spend only a certain amount on healthcare, regardless of
increases in premiums or the number of dependents needing coverage. San Francisco will pay up to $733 per month
for the combined premiums of individuals and dependents. In Tulsa the cap is $450, and in Little Rock
it’s $283 per month. Jefferson
County, Colorado and Denver give the same monthly payment to all
teachers to go towards medical, dental, and vision coverage, regardless of the
number of dependents. In Jefferson
County the monthly allocation is $515; in Denver, it’s $415.
Go
to Tr3’s custom report page to access all the data we use in Tr3 Trends
and to compare teacher policies in 114 school districts nationwide. Send
feedback to gmoored@nctq.org.

More like this


The data and analyses district leaders used to support their work in 2024