To see the most up-to-date data and analysis, view this new review of teacher salaries from February 2021.
With strikes and walkouts happening across the United States, teacher salaries are a hot topic. Even presidential contenders are weighing in, making education at least a talking point in the 2020 election.
This month, the District Trendline takes the teacher salary conversation back to the basics. Using data from the NCTQ Teacher Contract Database on the 100 largest districts in the country along with the largest in each state, we take a look at how teacher salaries are structured, how much teachers make, and investigate if salaries have kept up with inflation over the last five years.
Steps and lanes still reign supreme
Traditionally, teachers have been paid on "step and lane" salary schedules where teachers earn raises for each additional year of experience ("steps") and can move to higher "lanes" by earning additional education credits and degrees. Step and lane schedules continue to be the most common salary structure for teachers in the 124 large districts in our sample, with 61 percent of districts using steps and lanes.

About one quarter of large districts use non-traditional salary structures. This category includes those districts where teachers earn raises primarily based on performance (such as Pinellas County (FL)), those that no longer compensate teachers for earning additional educational credits (like Wake County (NC)), or those that provide an alternative pathway to higher salaries other than experience and education credits (like the District of Columbia). The remaining districts (n=16) do not publish salary schedules and instead rely on annual raises as determined by the school board. All but one of these districts are located in Texas.
What are teachers making?
The average starting salary for teachers in our sample is $44,236 after adjusting for cost of living. When teachers make it to the top of the salary schedule, teachers are eligible to earn on average $78,947, the maximum available base salary after adjusting for cost of living.[1]
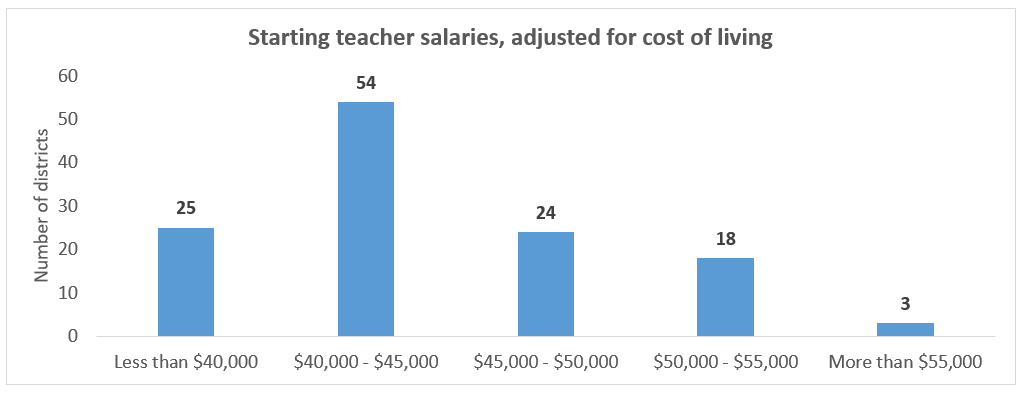
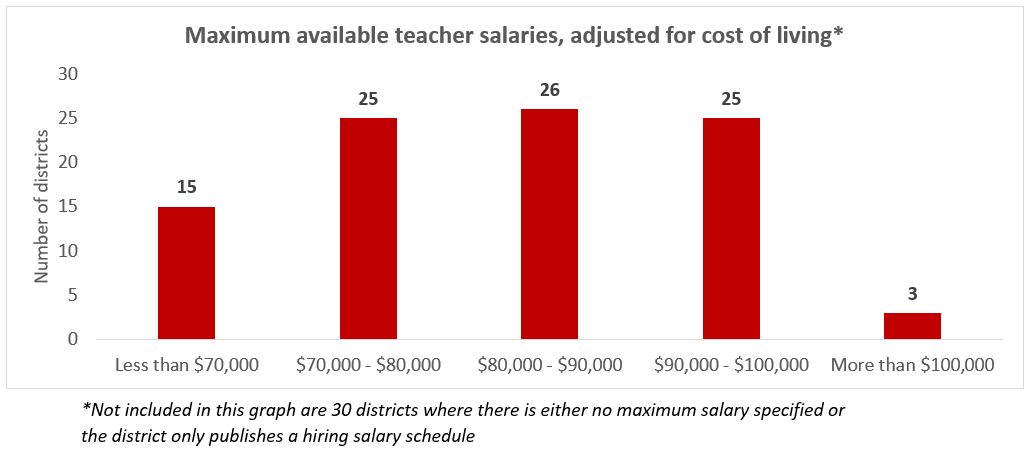
Of course, averages mask great variation between districts. At the top of the salary schedule, teachers in Corona-Norco (CA) can make just over $121,000 while teachers at the top of the schedule in West Ada (ID) make just under $58,000, after adjusting for cost of living. You can explore more teacher salary information using our interactive map.
Getting to the top
On average, it takes 24 years to qualify to earn the maximum salary available (if a teacher has a master's degree). Districts with shorter climbs to the top of the salary schedule offer teachers better lifetime earnings potential, a more attractive choice for younger teachers.
Although research continues to find that master's degrees and additional education do not improve teacher quality, educational attainment remains one of the primary ways that teachers earn raises. On average, large districts have five different "lanes" for teachers based on their level of educational attainment. Again the average masks large variances, with a few districts having only one lane (where education credits do not factor into salary) to Billings, Montana that has 13 lanes! Generally speaking, teachers need to earn a Ph.D. in order to move to the furthest lane and make the highest salaries. You can learn more about how teacher salary is impacted by educational attainment in one of our previous posts.
Are teacher salaries keeping up with inflation?
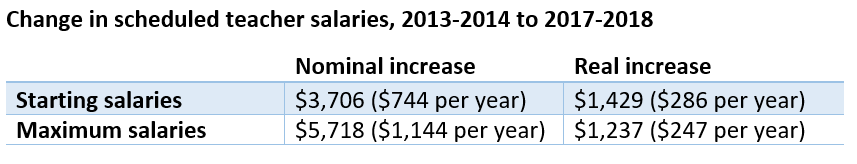
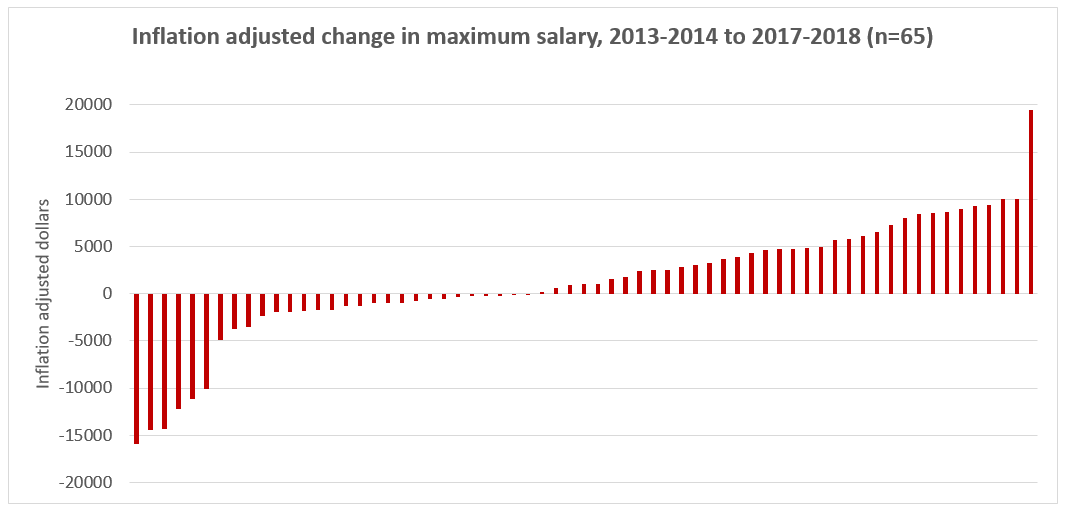
For 65 districts in our sample, we can compare teacher salaries over a five-year period (2013-2014 to 2017-2018) by adjusting for inflation.[2] We look at two points on the salary schedule: starting salary for a teacher with a bachelor's degree (the first step) and the maximum available salary on the schedule (the top step in the last column).
On average, starting salaries increased by $3,720 (an average of $744 per year) and maximum salaries increased by $5,718 (an average of $1,144 per year) over that five-year period. After adjusting for inflation, however, these raises drop by more than 50 percent to a $1,429 increase in starting salaries (an average of $286 per year) and a $1,237 increase in maximum salaries (an average of $247 per year).
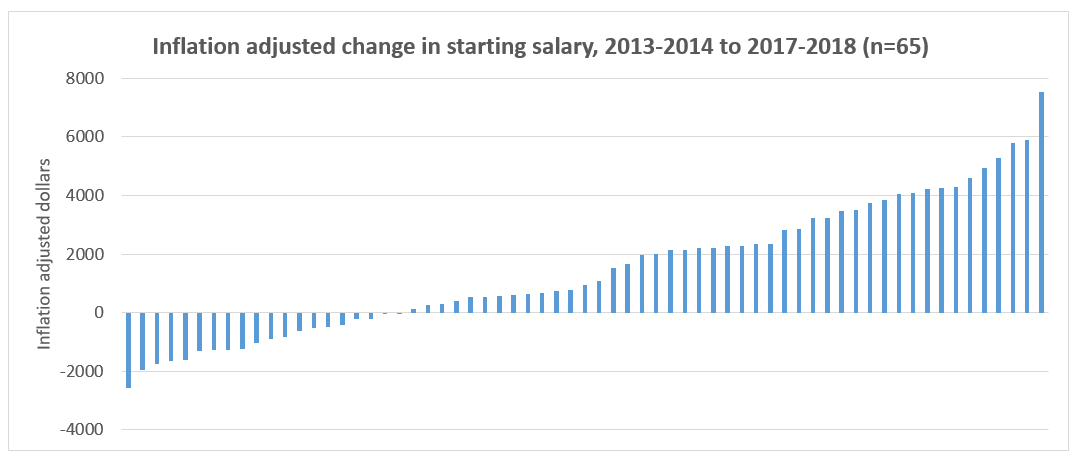
In fact, over half of the districts (51 percent) increased starting salaries by less than $1,000 after adjusting for inflation over a five-year period, an average of only $200 a year, despite the need to make early career salaries more appealing and competitive with other careers.
In nearly one-third of districts (31 percent) starting teacher salaries actually decreased after adjusting for inflation.
The story is similar for maximum salaries. More than half of the districts (51 percent) increased maximum salaries by less than $1,000 after adjusting for inflation and in 45 percent of districts maximum salaries decreased after adjusting for inflation.
You can explore all of the data for yourself using our interactive map.
[1] To adjust for the cost of living, NCTQ uses the Regional Price Parities by Metropolitan Statistical Area developed by the Bureau of Economic Analysis at the US Department of Commerce.
[2] In order to adjust for inflation, we used the Department of Labor's Consumer Price Index. We calculated 2013-2014 salaries as real April 2018 dollars and then compared the 2017-2018 salaries to those inflation-adjusted 2013-2014 salaries.