June 2014: Student enrollment
District Trendline, previously known as Teacher Trendline, provides actionable research to improve district personnel policies that will strengthen the teacher workforce. Want evidence-based guidance on policies and practices that will enhance your ability to recruit, develop, and retain great teachers delivered right to your inbox each month? Subscribe here.
The NCTQ Teacher Contract
Database aims to cover as many large districts as possible out of the nearly 13,600 districts across the country. Since the Database launched in 2009, student
enrollment has shifted in several states, in turn adding districts to the
Database over the years in order to make sure we are covering the 50 largest
districts in the U.S. and the largest district in each state.
In this month’s Trendline, we
examine districts with the most dramatic changes in student enrollment within the
50 largest districts in the country, from 2009 to 2011.[1]
Changes in student
enrollment from 2009 to 2011
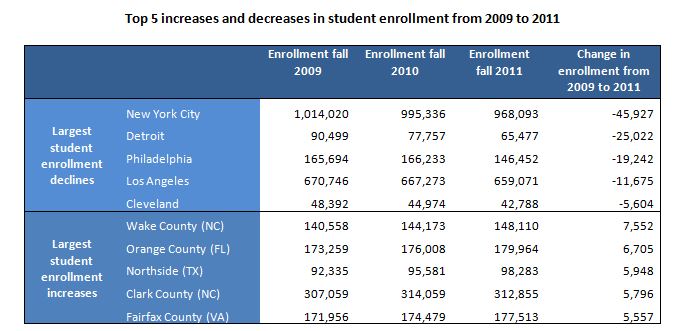
The top ten largest districts
across the country remained the same from 2009 to 2011. Nevertheless, student
enrollment has steadily decreased in the three largest districts- New York, Los Angeles and Chicago– while the other seven districts have increased in
size overall during that same time.
New York City, despite a decrease of nearly 50,000 students
from 2009 to 2011, dwarfs all other districts. Even with its loss in
enrollment, in 2011 it had almost 50 percent more students than Los Angeles and more than double the number
of students in Chicago.

In
the five districts –Northside (TX), Wake County (NC), Orange County (FL), Fairfax County (VA) and Clark County (NV)– where student enrollment rose the most from
2009 to 2011, the increase was within a relatively small range, between 5,500
to 7,500 students. The same cannot be said about the top five districts where
enrollments declined the most during that same period. These districts faced
enrollment losses anywhere between 5,600 students in Cleveland to 46,000 students in New
York City.
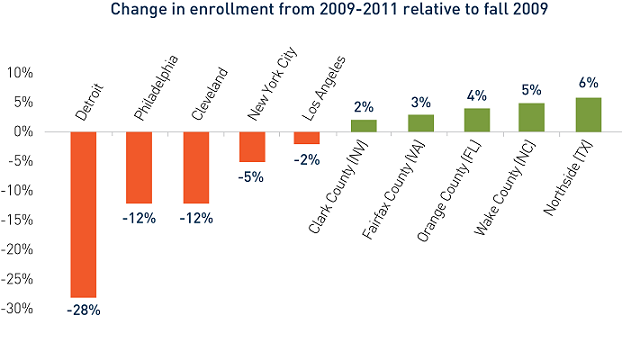
Those
enrollment declines may sound steep, but it’s important to keep district size
in mind when considering those numbers. While New
York
City
had the largest loss in absolute student enrollment from 2009 to 2011, it was
only a five percent decline relative to its enrollment in fall 2009. The
losses in Detroit, Philadelphia and Cleveland,on the other hand, were much larger
relative to their 2009 enrollment numbers.
Possible reasons for
enrollment changes
Cleveland, Detroit,
Los Angeles, New
York City and Philadelphia experienced
some of the most dramatic declines in student enrollment of the 50 largest
districts in the country.
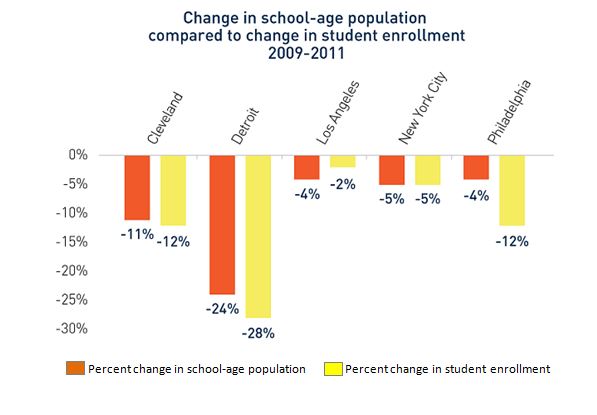
One likely reason behind these declines lies in
the population of school-age children in these cities. Using American Community Survey data, we find that the population of 5-19 years
old in each of these cities declined from 2009 to 2011.
These cities’ decrease in the
population of school-age children puts these declines in student enrollment in an
important context. While Los Angeles’s student
enrollment decreased by two percent from 2009 to 2011, the population of
school-age children in the city declined by four percent in that same time. The
same can be said for Cleveland
and New York City,where declines in student enrollment were
slightly less than the declines in school-age population.
Declines in school-age populations do not,
however, explain all of the student enrollment losses in Detroit
and Philadelphia. Detroit took a bigger hit to its
student enrollment than its loss in school-age population would suggest. Philadelphia, however, is particularly
startling; its relative decline in student enrollment was three times the city’s
relative decline in school-age population.
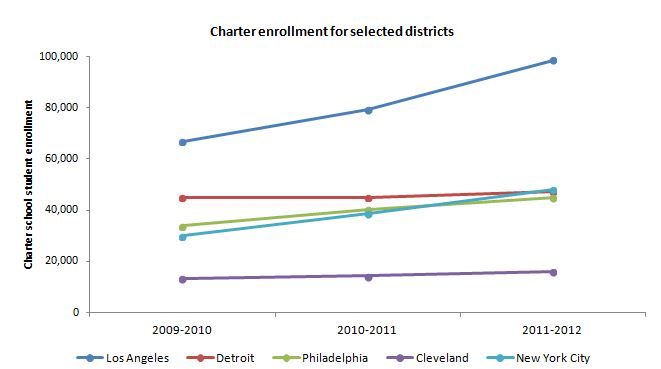
Charter school enrollment is
another probable explanation behind some of the decline in student enrollment
in these particular cities. According to the National
Alliance for Public Charter Schools, these
five districts are among those where public charter schools educate at least 10
percent of school-age students in the district.
Since 2009, charter school
enrollment has increased for all five districts, particularly in Los Angeles and New
York City, where the numbers rose by 31,000 and 18,000 students,
respectively. Philadelphia’s decline in
student enrollment in traditional public schools could partially be explained
by the nearly 11,000 student increase in charter school enrollments from 2009
to 2011.
Interestingly, Detroit
—with an increase of about 2,000 charter school students— had the lowest
increase in charter school enrollments relative to this set of districts. Given
that traditional public school enrollments declined more than the city’s drop
in school-age population, these numbers may be surprising for those who would
assume that charters were the biggest factor drawing students away from Detroit’s traditional public school
system.
As Detroit illustrates, there are many
factors influencing student enrollment trends. While charter schools are
growing across the country, it
is assumed by some that this growth is the main cause behind the decline in
traditional public school enrollment. We see here that is not always the case.
[1] The most recent information available from the
National Center on Education Statistics (NCES) is used for student enrollment
and national enrollment ranks.